Working with external data
Working with external data
Simile provides a mechanism to enable data to be associated with model variables when you run the model, rather than having the values built into the model itself. The mechanism is based on a file called the scenario file. For each variable, this file contains either the actual values, or a reference to another location which contains the values. This other location can be:
- a text file, in CSV (comma-separated value) format containing the data, either in a single column or as a grid of values.
- an image file, with each pixel standing for a data value according to its colour,
- any of a range of other raw data formats supported by the GDAL library (GeoTIFF, NetCDF 4, .hgt, etc)
- A column in a MySQL database or Excel data file (.xls, .xlsx, etc)
A "scenario" is then the set of all the values required for the model to run. These include parameter values, site conditions, initial values for compartments, time-series data (e.g. a rainfall record), etc.
This section first provides an overview of the scenario file mechanism, outlining its motivation and capabilities. We then look at the two types of input parameters, the elements by which external data comes into the model. The File Parameter and Table Data dialogues are used to set up the relationshop between data files and parameters. We show how to create .csv files, which are the most widely used kind of data file. We then discuss how modifying parameterization fits into the model edit/run cycle, and provide some worked examples.
See also the 4th video in the Simile Tutorial Series.
In: Contents
Working with external data : Overview
Overview of the scenario file mechanism
A simulation model may require various types of input data. These can include:
- values for parameters
- values for site conditions: e.g. soil type
- values for time-varying inputs (exogenous variables, such as temperature)
- initial values for compartments (state variables)
- values for management decisions: e.g. harvesting rate
For each of these, there may be a need to enter a set of values. For example, a compartment of a site-condition variable may be in a multiple-instance submodel and so (if you do not want all instances to have the same value), you will need to provide a different value for each instance.
We have seen a number of ways in which numerical data can be included in the model, in the section on equations. These include:
- Including numerical constants in the text of equations
- Sampling from a random distribution
- Including a sketch graph or table function
...and we have also seen how fixed or variable parameters can be set when running the model, by:
- using the slider helper
- Using the grid or polygon helpers in "edit" mode
However, none of these mechanisms satisfies a common modelling requirement: that a set of data values be provided for the model when the model is run. We need to be able to store the set of values in one or more files, and specify which set is to be used for a particular run. This is where the File Parameter mechanism comes in.
Design of the Simile File Parameter mechanism
The File Parameter mechanism was designed to meet the following design goals:
- A model can be complete even though it is lacking data values needed to simulate its behaviour. By complete, I mean that Simile can proceed to build the model: i.e. generate the Tcl or C++ program. Simulating the behaviour of the model requires that the built model is associated with one or more files ("scenario files") at run time. The job of these files is to tell Simile how to obtain values for variables in the model that have not had a value provided.
- One model can be associated with several scenario files for a single run, each file providing values for a different subset of variables.
- Different runs of the model can be associated with a different set of scenario files (thus allowing the modeller to quickly change data inputs for a model).
- The scenario file may either contain actual data values (e.g. for a single-valued parameter), or may contain a reference to a file in a standard format containing tabulated data. This means that a single (potentially very large) datafile can be referenced by several scenario files, thus avoiding the need to duplicate the same large volumes of data in a number of scenario files.
Working with external data : Input parameters
Parameters
The term 'parameter' usually refers to a symbol in an equation that can take on different values. When discussing equations in Simile, we use the term to describe the local names for values from other Simile components. However, here we are talking about quantities that are parameters for the whole model; special components whose values are specified externally and will change from one run to the next as the simulated conditions change. The values for these components come from outside the model; if they have equations, these are only used to set the dimensionality or provide default values.
There are two kinds of parameter that can be used in models. A variable in Simile can be marked as a fixed or variable parameter by ticking the appropriate radio button in the equation dialogue. A compartment can be a fixed parameter (i.e., its initial value is set externally) but not a variable parameter.
|
The value of a fixed parameter is set when the model is ready to run, and can be taken from a file, a table editor, or entered directly. It does not change its value during the simulation. In Simile v6 or lower, any value in the equation is ignored, and used only to set the parameter's dimensions. As of Simile v7, any value in the equation is used as a default if no other has been set. |
|
|
The value of a variable parameter is first set when the model is initialized or reset, and it can change throughout the simulation. Values can be taken from a file, a table editor, or using a slider control. The value in the equation is used as a default if no other has been set. If no value is entered, the default is the midpoint between the lower and upper bounds. |
 Fixed parameter
 Variable parameter
Dimensionality
When you are adding file parameters to your model, it is important that they have the right dimensions for the data that they will hold. The file parameter dialogue only allows you to enter data that has the same dimensions as the parameter that is to represent it in the model. A fixed parameter that is not inside a multi-instance submodel will only accept a single numerical value. To enter an array of values, you must first make your parameter an array, either by putting it inside a fixed-membership multi-instance submodel, or by giving it an equation whose result has array dimensions, e.g., by using the makearray(...) function.
See also the 2nd video in the Simile Tutorial Series.
In: Contents >> Working with equations
Working with external data : Fixed parameters
Fixed parameters
A value of a fixed parameter is not stored with the model, but is supplied by the user when the model runs. The value cannot change during the simulation. To set the value of a fixed parameter use scenario files. These are loaded as the model is built or reset.
Use the "Units" field to define the units as integer (int), real or Boolean (Boolean). An equation can be entered whose dimensions will be used as the dimensions of the parameter data. In Simile v7 or later, the equation also sets its value if no value is entered via the parameter mechanism.
Use the equation dialogue box to designate a variable as a fixed parameter. It is also possible to set the initial value of a compartment in the same way. A fixed parameter is shown on the model diagram with a  paper roll behind its usual appearance.
In: Contents >> Working with equations >> Parameters
Working with external data : Variable parameters
Variable parameters
A value of a variable parameter is not stored with the model, but is supplied by the user when the model runs. The value can change during the simulation. There are several ways to set the value of a variable parameter. One is to use slider controls. These can be displayed in the run-time environment and provide a mechanism for the user to observe and adjust the value of the parameter. The other is to use scenario files. These are loaded as the model is built or reset, and can provide a time-series of values for the parameter.
Maximum and minimum values must be set to define the range of acceptable values for the parameter. This allows the slider control to be shown with the correct range. It is also possible to define whether the slider moves continuously or in integer increments. Use the "Units" field to define the units as integer (int) or real to effect this distinction. It is also possible to present a check-box to the user, to return the Boolean values true or false. This is accomplished by setting the "Units" field to boolean. Finally, a variable parameter can be an enumerated type; set the "Units" field to the name of the required type. In this case the slider helper will present a pull-down menu for the parameter, listing the type's members.
Use the equation dialogue box to designate a variable as an variable parameter. It is not possible to set the value of a compartment in the same way, as variable parameters get new values from outside during the execution of the model, while compartments' values are determined from their previous values by the rates of flows in and out. A variable parameter is shown on the model diagram with a slider bar behind its usual appearance.
In: Contents >> Working with equations >> Parameters
Working with external data: the File Parameter dialogue
The File Parameter dialogue allows the modeller to specify where every parameter in the model gets its values from. It contains an entry box for each parameter, which displays the values associated with it, and when you hover over it it pops up information about where those values come from. Hovering over the parameter captions, listed to the left of the entry fields, displays the units and dimensions of the required data. Simple values can be typed in directly, while long lists can be loaded from data files.
Entering the dialogue
The dialogue will be displayed whenever running a model which is missing some parameter values.
In Simile v7, the same information is present in the Parameters tab in the explorer pane of the model run environment, and parameters can be altered there. In earlier versions, the dialogue can be displayed again for the purpose of altering parameter values, by hitting the  properties button in the toolbar of the model run environment.
Using the dialogue
The dialogue divides the parameters up into their submodel levels, and includes buttons at each level to the right of the submodel name. The outermost level is titled 'TOP LEVEL' and the buttons to the right of this heading affect all the values in the model. The same set of buttons appears for each submodel level, where they affect only the parameter values inside that submodel.These buttons do the following:
- Clear all values from that submodel's parameters
- Load values from a scenario file
- Create a scenario file containing these values
Note that if you create a scenario file for a submodel, the parameters in that submodel will be referenced in the file relative to that submodel level, not the whole model. So a file saved for a submodel cannot be loaded at the top level, or vice versa. However, a scenario file saved for one submodel can be loaded into another if they have the same internal layout of file parameters.
Inside the submodel boxes, there is a line for each fixed or variable parameter in that submodel. The line has an entry field into which single values, small arrays and time series can be typed, and buttons to the right. The 'tick' and 'cross' symbols finish and restart editing respectively. The 'pencil' symbol only appears for array or time series parameters, and opens the table entry dialogue for that parameter. If the table entry dialogue has already been used to enter a large data set for a parameter, the entry box will be greyed out and the tick and cross buttons will no appear -- the only way to edit the data set is to reopen the table entry dialogue.
The file parameter dialogue is displayed when you first run a model that contains fixed parameters. It can be displayed again by selecting the "Parameters..." menu item, which is in the file menu on the single-window model run environment, or under the "I/O Tools" menu on the model window if using the multiple-window model run environment.
Comments on parameter values
It is possible to add a comment to a particular parameter value or array of values. Such a comment applies to the value itself rather than the parameter which takes that value. Use it for noting how the value was derived, e.g., from what publication it came. The comment will be popped up when you hover over the value field, along with the actual file reference. These comments will be saved with the references in the scenario files.
To edit a value's comment, double-click on its entry field. There is also a text box for editing a value's comments in the table data dialogue.
In: Contents >> Working with external data
File Parameter dialogue : Entering values directly
The simplest way to set a file parameter is to type its value straight into the entry box beside its caption in the file parameter dialogue. For single values, this is the only way to enter them initially. The tick button replaces the currently saved value with what has been typed in, while the cross button reverts the entry field to the saved value.
The datatype (e.g., INTEGER or REAL) is displayed by hovering over the caption to the left. This will also display any comment associated with the parameter. If multiple values are required, the dimensions will also be displayed at this point, e.g., 3 x 3 of REAL). If there are multiple values, you get the pencil icon to the right of the entry field, which normally you would use to load them from a file. However, you can choose to type them in.
In Simile v7, arrays and lists are entered in the JSON format. In this format, an array is an ordered list of its members, separated by commas, enclosed in square brackets. Thus a 5-element array of real could be [2.5,3.5,1.5,2.5,3.5], while a 3x3-element array of integer might be: [[5,10,15],[6,7,9],[4,1,8]]. A list is a list of pairs of index and value, with a colon between the index and value, and the pairs separated by commas, enclosed in curly brackets. Thus a time series with integer values applying at times 10, 50 and 100 could be written: {10:33, 50:45, 100:78}. An array can also be written as a list, with the integers from 1 to its size as the indices. The index-value pairs in a list do not need to be in any particular order. The older format described below also works, for the sake of backward compatibility.
In earlier versions, when typing in multiple values, you must alternate between indices and values at each level, and group sub-arrays in curly brackets. So for instance a five-element array of real could be: 1 2.5 2 3.5 3 1.5 4 2.5 5 3.5, while a 3x3-element array of integer might be: 1 {1 5 2 10 3 15} 2 {1 6 2 7 3 9} 3 {1 4 2 1 3 8}.
If redisplaying the file parameter dialogue in an earlier version, the values will be shown with hashes and colons around the indices, to make the data more readable. For instance the five-element array above would look like this: #1: 2.5 #2: 3.5 #3: 1.5 #4: 2.5 #5: 3.5. You must keep these if editing the entry field to change the value, but at this point you can also go to the table data dialogue and edit the values in a version of the table helper. If the values have previously been loaded from a datafile and there are very many of them, the entry field will be greyed out so you cannot type into it, and will also contain an ellipsis rather than listing all the values. In this case they can only be changed via the table entry dialogue.
In: Contents >> Working with external data >> The file parameter dialogue
Working with external data : Specifying time series
The File Parameters dialogue will contain entry fields for both fixed and variable parameters. Fixed parameters must be given a value; their captions in the dialogue will be shown in red until a correctly formatted value has been supplied. Variable parameters do not need a value, and can be left empty, so the value can be set by a slider while running the model. However, it is possible to enter a time series in the File Parameters dialogue, which will cause the variable parameter's value to be set at a series of specified time points while the model is running. You would normally set up the time series using the table data dialogue, but the direct method is described here to clarify the analogy with setting values for an array.
Entry format
The format for entering a time series is the same as for a one-dimensional array, except time points are given instead of indices. The time points can be REAL values, and do not have to be at regular intervals. Data for time point zero is loaded whenever the model is reset. So, to set a value five times between time 0 and time 100, the entry might look like this: 0 12 20 11 40 8 60 7 80 9
If the value to be set is an array, the data must specify a multi-dimensional array, with the time points as the outermost indices.
Special indices and values
The data for a time series can include various combinations of special index and value, which affect how the numerical data is interpreted:
- Data at time point NOW is loaded into the model as soon as the File Parameters dialogue is closed, and then not used again. Wiggling a slider effectively sets data at time point NOW.
- For time point OTHERS, you do not enter a value; instead, you enter one of the special values use_last, use_closest or interpolate. These select the different methods for getting a value when the time is not exactly equal to one of the indices in the series. use_last specifies the default behaviour; each value stays in the model until the next time point is reached. use_closest causes the value to change midway between the two specified time points, while interpolate means the value changes continuously and linearly between one specified time point and the next.
- The INTERVAL time point allows you to supply a time unit which applies to the other indices. This can be useful if you have files containing time series data with the times specified in different units. For instance, if the supply the following data for a time series: 1 3.2 2 4.5 3 6.3 INTERVAL week ...then unless the time unit for model execution is set to something other than day, the variable will change value at times 7, 14 and 21. The time unit can be anything that Simile understands, e.g., ms.
- There is also another special value, restart, which has a normal numerical time point as its index; this specifies a time at which the model starts reusing values at the beginning of the time series, starting with time 0. The value will then follow a regular pattern, whose period is the time index of the restart value. The time for restart must be the last in the sequence.
Example: rough approximation of sinusoidal variation with period 100 time units:
0 0 12.5 0.7 25 1 37.5 0.7 62.5 -0.7 75 -1 87.5 -0.7 OTHERS interpolate 100 restart
When entering time series values in the table data dialogue, there are special buttons to get these behaviours by setting the special indices and values.
In: Contents >> Working with external data >> The file parameter dialogue
Working with external data : Referencing data in files
Ther normal way to use the file parameter system is to create and save references to data in other files. To do this, click the 'pencil' icon to the right of the data entry field. This brings up the table data dialogue, which allows you to specify the file containing the data, and how to get the data from the file.
Once this has been done, hovering over the entry field will produce a popup showing which file contains the actual data. Hitting the 'pencil' button again will show the reference information and allow it to be altered.
In: Contents >> Working with external data >> The file parameter dialogue
Working with external data : Loading and saving scenario files
Once you have specified the data for all the file parameters, you can save that data in a scenario file (extension .spf, sometimes referred to as a parameter metafile). This file does not necessarily contain the actual data, it can contain references to the files that actually contain the data. It is in an XML format, allowing it to be examined and edited if required.
The normal way to save the scenario file is to click the 'diskette' button in the top-right corner of the file parameter dialogue, by the caption TOP LEVEL. This will create a file containing information for all the parameters in the model. You can save a scenario file for just the parameters in a submodel, by clicking on the 'diskette' button to the right of the caption for that submodel. This file will include the information for all submodels under that one in the hierarchy.
When the scenario file is saved, the locations of any data files referred to will be included as relative paths. This means that if you move the scenario file to a new location, for instance when copying the model and its data to another computer, the data files must be in the same location relative to the scenario file (e.g., in the same folder) as they were when it was set up.
To load a scenario file, click the 'open folder' button to the right of the submodel caption. This action will not load the data itself; that only happens when you click the 'tick' beside a parameter's entry field, or hit the 'OK' button at the bottom of the dialogue. If you have made separate scenario files for submodels, it is important that they are loaded into the same submodels for which they were saved, otherwise Simile will not be able to find the file parameter elements that they refer to, since it will be looking in the wrong submodel or at the wrong level. Loading a scenario file overwrites any information that was already present for the parameters mentioned in the file. This allows you to have one set of values for a submodel saved as part of a top-level scenario file, but still load different values just for that submodel from another scenario file.
In: Contents >> Working with external data >> The file parameter dialogue
Working with external data: The Table Data dialogue
The Table Data dialogue is used to specify how to extract data from a file of any one of a number of formats so that it can be used in a Simile component. Its main use is for getting data for file parameters, but it also appears when creating a table function that is built into a component's equation.
There are four tabs in the dialogue, corresponding to the four varieties of supported data format. These are:
- .csv or ODBC-compatible file, or MySQL database: data in columns
- .csv file: data in grid
- Data from image (various formats)
- Data from GeoTIFF or other GDAL-compatible file.
In addition, this dialogue also allows you to:
- View or edit data directy in a grid
- Specify interpolation and wraparound for time series
- Include raw data in scenario file.
In: Contents >> Working with external data
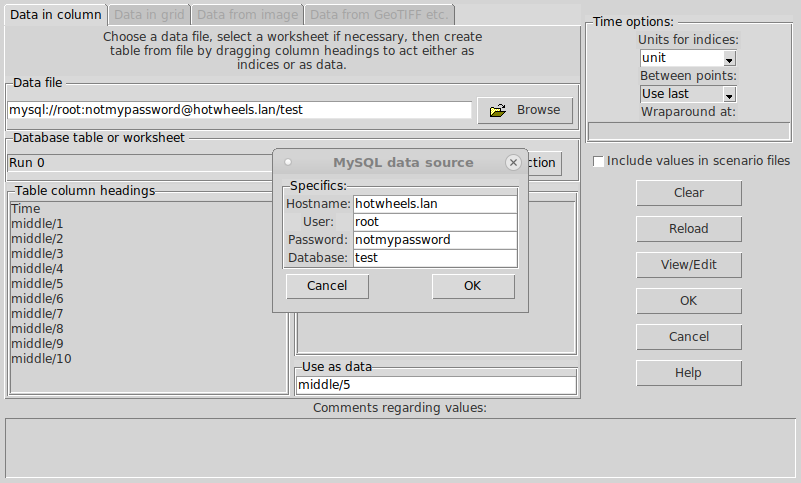
Working with external data : .csv file with data in column
This is the first tab in the table data dialogue. Use this method if the data for each component is in a single column in a file or database.
To select a file as the source of the data, hit the "Browse..." button and navigate to it. You can select .csv or Excel-compatible files this way. As of Simile v6.9 you can also load columns from a MySQL database. To to this, hit the "MySQL Connection" button and supply the hostname, username, password and database ID for MySQL.
If using a MySQL database or an ODBC-compatible format of file (e.g., .xls) then once you have browsed to the required file or entered the database access information, you must select the table in which the relevant data appears, using the "Database table or worksheet" pulldown menu. Once the table is selected, the column headers will be loaded into the list box below. If using a .csv file, this is not needed because the whole file is one table. When selecting the file you can also edit the character (comma by default) that separates the columns.
Storing data in a file
In order to be able to access the data, they must be stored in a certain format in the file. The file should be rectangular, consisting of a certain number of rows and a certain number of columns. The number of columns corresponds to the number of variables in the file (or, in database terms, the number of fields for each record). The file has as many records as there are units for which data were recorded, plus a single header record. The format is comma-separated values (CSV) which means that each value is separated by a comma from the preceding value. There is no comma at the end of a record. Most software packages that handle data can create files in this format.
The following is an example of a simple file containing data on the age, height and diameter of five trees:
age, height, diameter
25, 15, 0.31
32, 17, 0.37
16, 10, 0.2
19, 12, 0.23
21, 14, 0.29
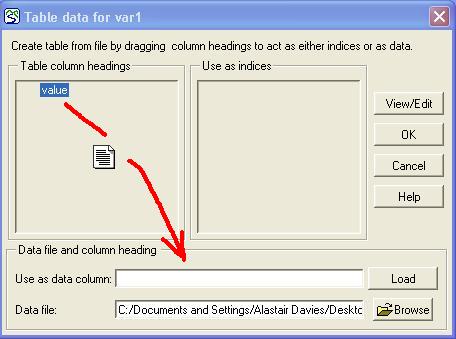
Creating a new table
To create a new table using the dialogue involves several steps. The first step is to select the file from which the table data are to be taken. To do this, click the "Browse" button on the dialogue box. The file path name is then displayed in the edit box "Data file".

If you are using a more recent version of Simile (5.4 or later), you can also select a data file in an ODBC-compatible format (eg, .xls) if you have the appropriate drivers loaded on your computer. In this case you also need to select the individual table or worksheet holding your data from a pulldown menu.
After selecting the file and datasheet, the table dialogue reads and displays the column headings in a list box. The column headings are taken from the first row of the file. The rest of the file is not checked, at this stage, for speed.
One (and only one) of these headings is used to designate the data column. Drag this column heading from the list box to the edit box labelled "Use as data column". In the example file shown above, you would have the choice of "age", "height" or "diameter" and could drag any one of these to the data column edit box. The cursor changes shape while you are dragging the heading, to represent the data moving.
If you wish to create one or more indices to the data column, drag the heading corresponding to the desired index into the list box labelled "Use as index". To delete an index, drag the column heading from the "Use as index" list box back into the "Table column headings" list box. It is not always necessary to designate an index. If none is given, the row number is used to access each record. If indices are given, then the array returned will consist of the values from the data column indexed by the value(s) from the index column(s) in the rows where they were found. Simile v6.7p2 introduces a new feature: if one or more index columns are specified, then the single word ,line can be used in place of a data column header, and this means that the data in the array will be the line numbers where each index value or combination of index values were found. For instance if the table at the bottom of this page were loaded with the index column headers Y index and X index (in that order!) and the data column header ,line then the first row of the resulting matrix would have the values 1,4,7, these being the rows where the y index of 1 was found, sorted by X index.
You can view the data you have loaded in a separate window. To do this, click the View/Edit button. You can make changes to the data in this window, and click OK to accept the changes or Cancel to abandon them. You can also save the data to a file. Note that if you extracted the data from a file containing more than one variable, you should not save the extracted data to the same file, or you will lose the other variables.
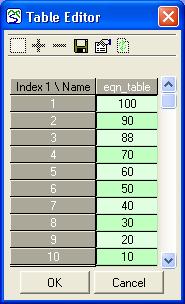
Editing an existing table
If a table already exists for the component, you will not need to follow the above steps again. If you wish to see or change the data in the table, you can click the View/Edit button. This will present you with the Table Editor, as above. If you wish to extract data from a different file, you can use the Browse button, as above, to begin as if creating a new table. If the data in the file have changed since the table was created, you can use the Load button, to extract the new data using the same specification of column heading and indices. (If the file is not present, perhaps because you are working on a different machine from where the model was created, clicking the load button will give an error.)
Final notes
When preparing to use multiple indices, it is often best to arrange the index columns in the data file in a logical sequence, for example as follows:
| X index | Y index | Height | Diameter |
| 1 | 1 |
12.3 |
1.3 |
| 1 | 2 |
12.7 |
1.2 |
| 1 | 3 |
13.1 |
0.9 |
| 2 | 1 |
11.8 |
1.5 |
| 2 | 2 |
12.3 |
1.4 |
| 2 | 3 |
11.7 |
0.9 |
| 3 | 1 |
13.5 |
1.0 |
| 3 | 2 |
12.1 |
1.1 |
| 3 | 3 |
13.0 |
1.1 |
For this file, two indices would be selected, the x- and y-values, together with one data column, either the height or the width. If both were needed, it would be necessary to have two variables, and to create a table in each one that each used one of these columns. The indices systematically provide values for a three-by-three grid. This makes it easy to extract the data using the first of the techniques outlined above.
In: Contents >> Working with external data >> The table data dialogue
Working with external data : .csv file with data in grid
If you have a .csv file with a 2-dimensional grid of data items, this can be loaded directly into a 2-dimensional array file parameter in Simile. For other 2-D formats that can be read into a spreadsheet, you can create the .csv file.
To use this file, go to the second tab in the table data dialogue. Here, you can browse to the file containing your data. When selecting the file you can also edit the character (comma by default) that separates the columns. Once you have done that, the four entry fields below will be filled, with "Finish at row" and "Finish at column" containing the number of rows and columns respectively in the file.
You can change the values in these fields in order to read only a part of the grid of values. This is most likely to be needed if the file contains headers that are not actually part of the data. For instance if the first row of the file contains headers, you specify "Start at row: 2" to avoid reading these into the table. You can use the View/Edit function to look at the data that will be read, and adjust the start row and column until it shows the data you want. Whatever values these have, the first row and column that is actually read will have index 1 in the data table (or 0 if it is a time series).
As of Simile 5.4 there are some extra features in this pane: the 'transpose' checkbutton causes the outer indices to correspond to the columns, rather than the rows. Also you can reverse the bounds, i.e., put a higher number in the "Start at..." than the "Finish at..." entries. This has the effect that the same part of the file will be read, but in the opposite order; the last row or column will contain the data items for index 1.
As of Simile v5.5 there is also the option to use fields from the grid as indices as well as data. This is analogous to the way index columns can be specified when reading data from columns, and is useful when the indices need to be enumerated type members. Below the entries for the start and finish rows and columns, there are pull-down menus to choose the source of the indices. By default these are set to "Position in data area", which causes the indices to be generated as described above. The row indices can also be got from "First column in grid" (i.e., leftmost column), or "Column to left of data". If either of these are selected, the index for each row will be the item in that row and the specified column. Note that you cannot choose these options if the data area starts at column 1, and if it starts at column 2 then they both do the same thing, i.e., get the index item from column 1. There are a similar set of options for getting the column indices from a row outside the data area.
In: Contents >> Working with external data >> The table data dialogue
Working with external data : Data from image
Simile can extract a 2-dimensional array of data from an image file, with each pixel in the image corresponding to a datapoint. The image can be in any format supported by the Tkimg package, which is to say, most of them.
To get image data, use the third tab in the table data dialogue. The upper panel on this tab is much the same as on the data in grid tab, and does much the same thing; you browse to the file, and select the positions in the image at which to start and finish reading data if you do not want the whole thing.As in the case of a data grid, you can reverse each axis or transpose the axes.

The unique bit is the bottom panel, Values for Colours, by which you can instruct how each colour in the image is to be converted into a value in the data array. "Value for black" and "Value for white" specify the endpoints of the range of values. For other colours, in general the lighter it is, the further from "black" and the closer to "white" the corresponding value will be. There is a pulldown menu with a choice of methods for getting values from other colours; "use luminosity" averages the intensity of red, green and blue, or you can use any of these levels on their own. For instance, an area of pure magenta will give the same value as white if using red or blue levels, and the same value as black if using green level. If using luminosity the value for magenta will be (2*white+black)/3. You can also select "use 8-bit colourmap" which just assigns a unique value to each colour in an 8-bit coloured image, the intention being that these same values are also available to set the colour legend in the grid helper, allowing a version of the image to be reproduced.
Finally there is a field to enter a value which will be used where the image is transparent (clear). You only need to enter a value here if your image has some transparent areas. This value can be outside the range from black to white.
In: Contents >> Working with external data >> The table data dialogue
Working with external data : Data from GeoTIFF or similar
GeoTIFF is a file format which is based on the TIFF image, but which is not actually an image and cannot be displayed in most image viewers. It differs from an image file in that:
- It also contains georeferencing data, and
- The image data can be in a number of formats including floating-point.
Simile uses GDAL (Georeferencing Data Abstraction Library) to read GeoTIFFs and other similar data files and convert them into 2-D arrays of parameter values. This library is not distributed with Simile, but it is Free Software; you must go and find it on the Web, and install it on your computer before you can use this feature of Simile. A version of GDAL is included in most Linux distributions and can be installed via the package manager. When it is installed, Simile can also create GeoTIFFs using the grid helper.
Havng done this, the procedure for reading data from a GeoTIFF is much the same as for a grid of values in a .csv file. The actual values in the file are used in the data array without any conversion; the assumption being that since they can be floating-point, whoever created the dataset would have been able to include physically meaningful values.
Because getting data from this type of file is a low-level operation, it is much faster than the other options for loading data from files where very large arrays are involved. However the price for this is the loss of the "transpose" and reverse ordering options.
In: Contents >> Working with external data >> The table data dialogue
Working with external data : View/edit as table
Once you are in the table data dialogue, you can hit the View/Edit button to bring up a version of the table helper to display your data and, if necessary, edit it. The data need not have come from a file; it might just have been typed into the entry field of the file parameters dialogue. However it will not work if the data has been loaded as raw data from the scenario file.
This tool has all the features of the table helper, i.e., you can arrange the different index and time point headings vertically or horizontally, and you can save the displayed data as a .csv file. It also allows you to edit the data, either by typing values into individual fields or by cutting and pasting a grid of values into the grid. For example, a quick way to transpose a square array: Put outer indices on rows and inner ones on columns, then cut all the data, then put inner indices on rows and outer ones on columns and paste it back in.
The main use of this tool though is to check after reading data from a file, using whatever method, that you have actually picked up the data you intended to get.
In: Contents >> Working with external data >> The table data dialogue
Working with external data : Time series
In the section on time series formats, we saw that the series includes special time points and special values to specify what what values to use away from the actual data points. If you are using one of the mechanisms provided by the table data dialogue to get your data, you do not have the opportunity to include these special points (unless they happen to be in your .csv file, and if they are, they work fine). But you can get the same effect by including them with the tools in the 'other times' panel in the top right corner. These are only available if providing values for a variable parameter when running the model.
The pulldown menu for "Between points" allows you to select from three options which have the same effect as the special values for the time point OTHERS: "use_last", "use_closest" and "interpolate". The entry for "Wraparound at" has the same effect as the time point given for the special value "restart".
There is also an entry field to set the units for your time series indices as described for the INTERVAL point.
In: Help >> Working with external data >> The Table Data dialogue
Working with external data : Raw data in scenario file
Normally, the scenario file contains only references to data files, with information as to how the data is to be extracted. However, if you type the data straight into the entry field in the file parameter dialogue, or edit it with the table editor from the table data dialogue, the resulting data no longer corresponds to anything that can be got from a data file, so instead the data is stored directly in the scenario file. This is usually a bad thing, because the XML format used is unwieldy and verbose, and it may take a long time to load or save. But keeping references in the scenario file also has disadvantages, chiefly:
-
When publishing a model with a scenario file like this, the file itself must be included along with all the other files referenced by it, and these must be installed in the same place in the directory tree relative to the scenario file as they were when the scenario was created
-
The process of loading values from a .csv file is quite time consuming, as the file has to be parsed and checked for syntax errors before the ASCII numerals can be converted into their actual values, and this has to be done every time the data is loaded.
So we came up with a way to maximize convenience, and added a checkbox to the table data dialogue captioned "Include values in scenario files". If you check this, then when you save a scenario file including the parameter in question, it will include all the data for that parameter even if it is also available in the datafile. Furthermore, instead of it all being in longhand XML, it will be in raw binary format, base64-encoded into Ascii and stuffed into a CDATA field.
This means it is small. And fast. If the model uses a lot of data that isn't going to change from one scenario to the next, this is the best way of handling it. There is a slight downside; the values are unpacked and loaded directly into the model's data structures, and are never converted into the TclTk format that allows them to be displayed as text (except for a few at the start and end, to display in the file parameter dialogue, and these give you just the raw numbers if using booleans or enumerated types). So you cannot look at them or change them with the table editor -- but that gets a bit difficult with very large arrays anyway. The only way to change them is to load them once more from a datafile.
In: Contents >> Working with external data >> The table data dialogue
Working with external data : Creating CSV files
Creating CSV files
Comma delimited (CSV or comma separated value) files can be created using most common data-handling software packages. There is usually a selection of file formats available in the Save dialogue box, as pictured here for Microsoft Excel.
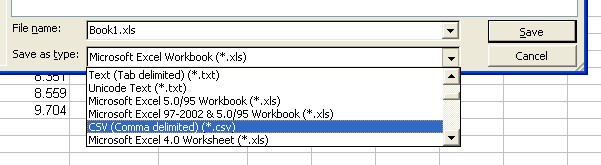
Note that if you get a choice of delimiters, you should choose comma between columns and newline between rows.
In: Contents >> Working with equations
Working with external data : Modifying scenario values during a session
Modifying scenario values during a session
You are only asked to specify a scenario file the first time you build and run a model that requires parameter values. So what do you do if you then want to modify scenario values prior to subsequent runs during the same session?
In Simile version 7 and later, the explorer pane in the model run environment window contains a notebook with two tabs, "Outputs" and "Parameters". All the parameter values in the current scenario appear under the Defaults heading in the Parameters tab, and they can be updated directly using any of the methods for setting them.
In earlier versions: select the option Parameters... under the File menu of the model run environment window, or under under the I/O tools menu of the model window if using multiple run windows. This produces the same dialogue window as you use to specify the scenario in the first place. You can edit any of the values you see; or you can re-load another set of data values from a .csv file to replace the ones already entered. You can also load a new scenario file, either for the whole model or for any submodel that contains file parameters.
In either case, if you change any values, you will be requested to restart the model before running it again, so the new values can take effect.
Working with external data : Running experiments
Running experiments
As of Simile v7.0, a model can be run simultaneously with its default parameters and with various other combinations of parameters, using multiple processors if they are available. A combination of such runs is known as an experiment, as it allows comparisons between output data from the default case with data from the experimental variations. The feature is similar in some ways to the experiment feature in Apsim NG, but Simile’s version does not allow parts of the actual model to be changed between cases, although this functionality may be added in the future.
Any model containing file parameters may be used as the basis for an experiment. When you run such a model, the explorer pane (beneath the run control pane) contains two tabs, titled ‘Outputs’ and ‘Parameters’. ‘Outputs’ shows a tree diagram containing all the values in the model arranged by submodel hierarchy, while ‘Parameters’ shows a similar arrangement with just the file parameters, including an entry field and setup button for each to allow them to be altered. The entry field will include the current value of the parameter if one has been entered, or the component’s equation if using a default value included in the model (indicated by the caption appearing in blue). This tree diagram appears under the 

 ‘Default case’ heading, indicating that these values correspond to the ‘real world’. There is also an
  ‘Experimental conditions’ heading, with an empty tree. This tree can be built up by adding experimental cases.
Adding experimental cases
To add an experimental case or set of cases, right-click (or ctrl-click if using a Mac) on the experimental conditions header. This will bring up a menu of different ways to add conditions.
Parameter value
This is the simplest way to add an experimental condition. It creates a condition in which just one parameter is varied from its default value, although that can be an array parameter. When you select this entry from the insert menu, the first thing to appear will be a dialogue box inviting you to enter a name for the new experimental case. This can be some description of the experimental procedure it is modelling, e.g., ‘swab all’.
After this dialogue is closed, a message will appear in the Parameters tree inviting you to select a model component to which to apply the new value. You can select this from the Parameters tree, or from the Outputs tree or the model diagram, but it must be a file parameter. Although the icon shows a fixed parameter, it can also be a  variable parameter, in which case the data for it will be an alternating list of time points and values to apply at those times. Once you have selected a parameter, an entry field for it will appear under the Experimental conditions header, as part of a new tree.
You can now provide a value for this version of the parameter, using any of the methods available to load values for file parameters. If it is a variable parameter, you will need to provide a time series. Because the caption of the entry is the component’s caption followed by the name of the experimental case, there may not be enough room in the pane for the entry widgets to show, in which case you can enlarge it by dragging the handle on the vertical sash between the explorer and visualization tool panes.
Once this is done, after you next reset the model, there will be two cases – the default case with the original value of that parameter, and the newly named case with the newly entered value. Visualization tools, component popups etc will show values from both cases, labelled as if they were array members.
You can add several values in this way, either for different parameters or for the same parameter in different cases. Each one will create an additional experimental case in which that particular value is applied to that parameter, but everything else is the same as the default case.
 List for parameter
If you want to add a number of experimental cases in which one particular parameter as one of a range of different values, select the entry “list for parameter” from the insert menu. After selection, you go immediately to choosing a file parameter to which to apply the different values. After choosing it, a new entry field is added to the experiment tree with the label of the parameter followed by ‘s’, meaning you can add multiple values.
At this point you can add a series of values using any of the means you would normally use to set up an array parameter. The indices can be text or numerical, and will become the names of the experimental cases for the corresponding values. If the parameter is itself an array or a time series, you need to create a nested array for the value, with the outer indices becoming the experimental case names.
If the parameter is a fixed scalar value, you can enter a series of cases for which it has a sequence of values. Instead of the normal index/value pairs, enter an expression of the form “a to b step c” for the range and frequency of values to use in the experiment. For instance if you set a list for a parameter called “level” with the entry “100 to 500 step 80” you will get cases with level set to 100, 180, 260, 340, 420 and 500. These cases will be named “level=100”, “level=180”, etc. If the step is 1 it can be left out of the entry, e.g., “2 to 6” gives cases for values of 2,3,4,5 and 6.
 Multi-factor case
If you want to create an experimental condition in which several parameter values are varied from their defaults, this is what you need to add to the experiment tree. When you select it from the insert menu, you are prompted to supply a name for the new experimental case, but that is all. The case will then appear under the experimental conditions tree. At this point, the case has the same values as the default case for all the parameters. You can add parameter values to this case by right clicking on the header. Note that only single parameter values can be added inside a multi-factor case, and only one entry field should be added for any parameter.
When you add a parameter value to a multi-factor case, you do not get to select a name for the case, because you are adding to the setup of the existing case. Instead it goes straight to picking the parameter which is to be adjusted. Continue to insert parameter value fields and enter values for them until your experimental case is complete. When you run the model now, you will see the default case and the named multi-factor case, with all the values you entered applied to their respective parameters in the latter.
 Set of permutations
In some experimental designs, a few parameters are varied and the results for each combination of possible variations are analyzed alongside the default condition. This kind of design is useful for finding particular combinations that produce exceptional results, though when working with Simile the PEST interface should also be considered for this purpose.
Simile’s experiment generator provides a tool for setting up such an experiment. The ‘set of permutations’ level can be added to the tree, and like the multi-factor case, other conditions can be added beneath it. However, rather than combining these conditions into a single case, it generates a case for each possible subset of them.
So, when a set of permutations is added, it does not itself generate a new case, or require a case name to be provided. Any of the other case specifications can be added under a permutation, and they will behave exactly as if they were added under the top level as described above. But if more than one is added, then as well as the cases they specify themselves, cases will be generated for all possible combinations of more than one of them.
For instance, if your model has two fixed parameters called ‘speed’ and ‘weight’, you might add a permutations level, and under it ad a parameter value for ‘speed’ as a case called ‘slow’, and a list for parameter ‘weight’, specified as ‘10 to 30 step 10’. The model execution will now contain the cases that these specify themselves, i.e., ‘slow’, ‘weight=10’, ‘weight=20’ and ‘weight=30’, but it will also contain combinations, named by combining the names of the cases that compose them, i.e., ‘slow+weight=10’, ‘slow+weight=20’ and ‘slow+weight=30’.
Note that adding a lot of separate cases under a permutation will very quickly give rise to a large number of conditions, e.g., five individual parameter values will give rise to 31 experimental cases in addition to the default.
In: Contents >> Working with external data
Working with external data : Worked Examples
Using the scenario file mechanism
Choose the use-case that is closest to your own requirement. Note, however, that in a typical application you will probably have more than one instance of some of these approaches, and you will be mixing several approaches. For example, one model may have several single-valued variables, some spatial data, and some time-series data. Together, these constitute the 'scenario'.
One a scenario has been set up according to the various use-cases detailed below, and saved in a scenario file, the scenario file can be loaded in subsequent Simile sessions simply by loading it in the scenario (parameter) file dialogue window.
Case 1: providing a single value for a scalar (single-valued) variable
The variable could represent, for example, a model parameter, a site condition, or be used to set the initial value of a compartment.
You can use this method if the variable is inside a submodel with a small number of instances.
Case 3: providing a set of values for an array variable: values stored in the scenario file
You can use this method if the variable is an array with a small number of elements.
You can use this method if the variable is inside a submodel with a large number of instances.
Case 5: providing a set of values for an array variable: values stored in a separate file
You can use this method if the variable is an array with a large number of elements
Case 6: providing values for 2-dimensional array or submodel variables
Arrays with 2 or more dimensions can be specified in a variety of ways
Case 7: Providing data for points in a time series
Each point may be a single value or an array of values; special points also discussed.
Scenario files can contain information for all the file parameters in a model, or just those relating to a single submodel, or a certain part of the submodel hierarchy. If you have a model which has file parameters spread across a lot of submodels, then the file parameter dialogue will include a lot of nested sunken frames, coresponding to the nested submodels containing the parameters. Each of these frames has a title, which is 'TOP LEVEL' for the whole model, or the caption for a submodel. To the right of this is a set of buttons, for clearing, loading and saving the parameters in that submodel and those contained within it. Saving parameters for submodels allows you to keep separate sets of parameters for different parts of your model, and to build scenarios by loading separate scenario files for different parts of the model, rather than having a single file for each possible combination of sub-scenarios.
Important: a scenario file must be loaded into the same submodel context from which it was saved, since the locations of the parameter components are specified relative to that submodel context.
Working with external data : Scenario file : Case 1
Case 1: providing a single value for a scalar (single-valued) variable
This case applies when the model requires just one value. In other words, the variable in question is not inside a multiple-instance submodel, and has not been declared to be an array.
Typical circumstances are:
- for providing a parameter value;
- for setting some context-specific value: e.g. soil type, elevation
- for initialising the value of a compartment.
On the model diagram
- Open up the equation dialogue for the variable, by double-clicking on it.
- Click the radio button labelled "Fixed Parameter".
- Close the equation dialogue window.
Note that the variable now appears with a tail, showing the change in its status. Note also that it is black, even though you have not supplied a value for it.
When you come to run the model
Simile will produce a File Parameter dialogue window, and this will contain an entry for this variable.
- Click in the associated edit field, and type in a value.
- Click Save if you wish to save this setting (along with any others), and specify a file to save it in.
- Click OK when you wish to proceed with the simulation.
In: Contents >> Working with external data >> Using scenario files
Working with external data : Scenario file : Case 2
Case 2: Providing a set of values for a variable in a fixed-membership multiple-instance submodel: values stored in the scenario file
This case applies when you have a variable in a fixed-membership submodel which has a small number of instances. A typical example might be a submodel whose job is to hold the values for each of several crop types. The number of crop types is probably small.
On the model diagram
- Open up the equation dialogue for the variable, by double-clicking on it.
- Click the radio button labelled "File Parameter".
- Close the equation dialogue window.
Note that the variable now appears with a tail, showing the change in its status. Note also that it is black, even though you have not supplied a value for it.
When you come to run the model
Simile will produce a File Parameter dialogue window, and this will contain an entry for this variable.
- Click in the associated edit field, and type in a n pairs of values, where n is the number of submodel instances. The first value of each pair should be the number 1, 2, 3, etc. The second should be the value you wish to assign to that instance. Thus, if the submodel has 4 instances, and you want to assign the values 4, 5, 6 and 9 to the 4 instances, then you should type in:
1 4 2 5 3 6 4 9
just like that (i.e. with no brackets, commas or whatever).
- Click Save if you wish to save this setting (along with any others), and specify a file to save it in.
- Click OK when you wish to proceed with the simulation.
In: Contents >> Working with external data >> Using scenario files
Working with external data : Scenario file : Case 3
Case 3: Providing a set of values for an array variable: values stored in the scenario file
This case applies when you have an array variable with a smallish number of elements. A typical example might be an array containing a parameter value for each of several crop types. The number of crop types is probably small (say, fewer than 20).
On the model diagram
- Open up the equation dialogue for the array variable that is to contain the time-series data, by double-clicking on it.
- Click the radio button labelled "File Parameter".
- Enter the expression makearray(1.0,n), changing n to the number of values in the time series, in the "Equation" edit field.
- Close the equation dialogue.
Note that the variable now appears with a tail, showing the change in its status. Note also that it is black, even though you have not supplied a value for it.
When you come to run the model
Simile will produce a File Parameter dialogue window, and this will contain an entry for this array variable.
- Click in the associated edit field, and type in a n pairs of values, where n is the number of submodel instances. The first value of each pair should be the number 1, 2, 3, etc. The second should be the value you wish to assign to that instance. Thus, if the submodel has four instances, and you want to assign the values 4, 5, 6 and 9 to the 4 instances, then you should type in:
1 4 2 5 3 6 4 9
just like that (i.e. with no brackets, commas or whatever).
- Click Save if you wish to save this setting (along with any others), and specify a file to save it in.
- Click OK when you wish to proceed with the simulation.
In: Contents >> Working with external data >> Using scenario files
Working with external data : Scenario file : Case 4
Case 4: Providing a set of values for a variable in a fixed-membership multiple-instance submodel: values stored in a separate file
This case applies when you have a variable in a fixed-membership submodel which has a largish number of instances. A typical example might be a submodel whose job is to hold the values for some attributes (e.g. elevation, soil type) of each of a large number of spatial patches.
On the model diagram
- Open up the equation dialogue for the variable, by double-clicking on it.
- Click the radio button labelled "File Parameter".
- Close the equation dialogue.
Note that the variable now appears with a tail, showing the change in its status. Note also that it is black, even though you have not supplied a value for it.
Check or prepare the data file
The data file should be in standard csv (comma-separated value) format. It should have one header line, consisting of one or more labels, separated by commas, followed by n lines. Each line should have the same number of values as there are labels in the header line, and again the values should be separated by commas. The number (n) of data lines should be at least as great as the number of instances for the submodel. One column should contain the values required for the variable in the model.
When you come to run the model
Simile will produce a File Parameter dialogue window, and this will contain an entry for this variable.
- Click on the Read table button for this variable.
- Select the "data in columns" tab of the table data dialogue.
- Browse through your file system to find the .csv file containing the data values.
You will now see a window listing the columns in the table, by the label associated with each column. - Double-click on the label corresponding to the column of values you wish to assign to the variable.
- Click on the OK button.
- Click Save if you wish to save this setting (along with any others), and specify a file to save it in.
- Click OK when you wish to proceed with the simulation.
In: Contents >> Working with external data >> Using scenario files
Working with external data : Scenario file : Case 5
Case 5: providing a set of values for an array variable: values stored in a separate file
This case applies when you have an variable with a largish number of elements. A typical example might be a variable outside a large multiple-instance submodel, containing a set of values that are to be used for each instance of the submodel..
On the model diagram
- Open up the equation dialogue for the variable, by double-clicking on it.
- Click the radio button labelled Fixed Parameter.
- Enter the expression makearray(1.0,n), replacing n by the number of elements in the array, into the "Equation" edit field.
- Close the equation dialogue.
Note that the variable now appears with a tail, showing the change in its status. It also has a 'stack' outline to indicate that it is an array. Note also that it is black, even though you have not supplied a value for it.
Check or prepare the data file
The data file should be in standard csv (comma-separated value) format. It should have one header line, consisting of one or more labels, separated by commas, followed by n lines. Each line should have the same number of values as there are labels in the header line, and again the values should be separated by commas. The number (n) of data lines should be at least as great as the number of instances for the submodel. One column should contain the values required for the variable in the model.
When you come to run the model
Simile will produce a File Parameter dialogue window, and this will contain an entry for this variable.
- Click on the Read table button for this variable
- Select the "data in columns" tab of the table data dialogue.
- Browse through your file system to find the .csv file containing the data values.
You will now see a window listing the columns in the table, by the label associated with each column.
- Double-click on the label corresponding to the column of values you wish to assign to the variable.
- Click on the OK button.
- Click Save if you wish to save this setting (along with any others), and specify a file to save it in.
- Click OK when you wish to proceed with the simulation.
In: Contents >> Working with external data >> Using scenario files
Working with external data : 2-dimensional arrays : Case 6
Case 6: providing values for 2-dimensional variables
A variable will need a 2-dimensional array of parameter values if it is itself a 2-dimensional array variable, or if it is inside a 2-dimensional multiple-instance submodel, or if it is a 1-dimensional array variable inside an ordinary multiple-instance submodel, or if it is inside 2 nested multiple-instance submodels.
There are two ways of providing two-dimensional data for such a variable. The first two are generalizations of methods already described, and can also be used for higher-dimensional variables. The third involves reading data directly from a file in a 2-dimensional format, and was introduced in Simile v4.8.
Values direct from scenario file
This method is limited to small arrays. You enter the data in the edit field in the file parameter value as for one-dimensional arrays, but in place of each value there is another list of index and value pairs, in curly brackets. For instance, the data for a 4x3 array of integers could be supplied as:
1 {1 4 2 9 3 1} 2 {1 8 2 5 3 6} 3 {1 9 2 11 3 6} 4 {1 0 2 7 3 9}
Note that after these values are accepted by the dialogue, it will show the indices with a hash and colon, e.g., #2: to distinguish them from the data items. They can in fact be entered either with or without these decorations, making it easier to enter them by cutting and pasting.
It is fairly easy to see how this mechanism can be extended to cope with higher-dimensional arrays.
Values from a column in a .csv (comma-separated value) file
The data file should be in standard csv (comma-separated value) format. It should have one header line, consisting of one or more labels, separated by commas, followed by n lines. Each line should have the same number of values as there are labels in the header line, and again the values should be separated by commas. The number (n) of data lines should be at least as great as the number of instances for the submodel. One column should contain the values required for the variable in the model. There should also be one column containing the outer index values, and one column containing the inner index values.
For instance, a .csv file to generate the same array as in the last subsection, might look like this:
IndH,IndV,Val,
1,1,4,
1,2,8,
1,3,9,
1,4,0,
2,1,9,
2,2,5,
2,3,11,
2,4,7,
3,1,1,
3,2,6,
3,3,6,
3,4,9,
Note that the row index (which would normally correspond to the outer index in a 2-D array within Simile) actually appears after the column index in the file. This does not matter; the columns can be in any order in the file. So can the rows, since their ordering in the model data is going to be specified by the values in the index columns, rather than their line numbers.
When you come to run the model
Simile will produce a File Parameter dialogue window, and this will contain an entry for this variable.
-
Click on the Read table button for this variable
-
Select the 'Data from column' tab in the Table Data dialogue, if it is not already selected
-
Browse through your file system to find the .csv file containing the data values.
-
Click on the OK button.
You will now see a window listing the columns in the table, by the label associated with each column.
-
Drag the header of the column containing the values for the outermost index across into the 'indices' listbox. In the example above, this column header is IndV.
-
Repeat this action for the inner index. In the example above, this column header is IndH.
-
Double-click on the label corresponding to the column of values you wish to assign to the variable. In the example, it is Val.
-
Click on the OK button.
-
Click Save if you wish to save this setting (along with any others), and specify a file to save it in.
-
Click OK when you wish to proceed with the simulation.
Values from a grid in a .csv file
In many cases, the data for a 2-d array is available as a grid of values in a .csv file, typically one saved by a spreadsheet. In such cases it is difficult to convert it to a single column with separate columns for indices, so Simile allows this type of data to be read directly. The rows in the grid will correspond to the outermost index of the Simile array, and the columns to the innermost index. If the grid data is arranged the other way round from this, the spreadsheet's 'transpose' function can be used to swap the rows and columns.
After you click the 'get values from file' button in the File Parameters dialogue, the Table Data dialogue contains four tabs. Initially, the 'Data in Column' tab is raised, but for this case we use the 'Data in Grid' tab. So first click on that tab to raise it.
Now we see a file selector, the same as in the previous examples. Use it to open your .csv file containing the grid of values.
On opening the file, the four entry fields for start/finish at row/column will be filled with the numbers of the first and last rows and columns respectively, providing indication of the total size of the grid of data in the file. Note that any header rows and/or columns will be included in these dimensions, so the 'start at' values will always be 1. At this point you can adjust the values to correspond to the part of the grid you actually want to load. At any time you can hit the View/Edit button on the right of the dialogue, to display a grid of the values in the part of the file currently selected for loading. Ths is useful if you are unsure which part of the file contains headers and which the numerical values. However, note that the table display tool only works up to a maximum of 10,000 rows or columns.
The size of the area you eventually select must match the dimensions of the array you need to load into the model. These dimensions are displayed in the header of the Table Data dialogue for convenience. Once you have chosen the appropriate start and end points, you can use the View/Edit button again to actually change some of the values (e.g., if some were badly formatted in the file) but be aware that if you do this and then save the scenario, all the values will be saved in the parameter file, rather than just a reference to the .csv file.
Values from an image or other binary-format file
Loading a 2-D array of data from an image is very much like loading it from a grid of numerical values. Follow the same procedure except, when you open the Table Data dialogue, select the 'Data from Image' tab. You then choose the area of the image from which you want to load values, exactly as was done for the case of loading data from a .csv grid, except in this case there are no header rows or columns to worry about.
There is an important extra step when using an image file - each pixel in an image has a colour, and you must specify how these colours are to be converted into numerical values to use in the model. This has to be done before you can use the View/Edit button, since the table will display numerical values. Each pixel will correspond to a number between a lower and an upper bound. These bounds are entered as 'Value for black' and 'Value for white', and these are the values that will be generated for black, and white, pixels respectively. Value for black can be greater than or less than value for white. Pixels of other colours will generate values between these two values, as specified in the 'For other colours' pulldown menu. For instance, if you select 'Use green level', a green pixel will give the same value as a white one, since the green level in white is 100%, while a red pixel will give the same value as a black one, since the red level in green is 0%.
If the image file has 8-bit colourmap data, as is the case for most GIF files, then these values can be used directly, and by setting the values for black and for white to 0 and 255 respectively, the values themselves will be preserved. Finally, some images contain transparent areas; when using such an image you must set a separate value for transparent pixels in the 'Value for clear' entry field. This need not be in the range between the values for black and for white.
Other grid data formats
Several other data file formats, principally GeoTIFFs, can be loaded into Simile model parameters if you have the Geospatial Data Abstraction Library (GDAL) installed on your computer. This library is not included in Simile's installation, but is distributed free of charge, and is available for all operating systems for which Simile is supported. The procedure for loading these data files is the same as for loading image data, except that since the values in the files are already interpreted as numerical rather than colour, there is no need to specify how they are to be converted to numeric values. Use the last tab in the table values dialogue (Data from GeoTIFF, etc).
In: Contents >> Working with external data >> Using scenario files
Working with external data : Time series : Case 7
Working with time series
There are two principle means of loading time series data into a model, depending on whether it is desired to store the data in the model itself, in which case the table(…) function is used, or whether the data are to be read from an external file, in which case a scenario file is appropriate. It is also possible to enter the data directly into an array, which may be convenient if there are only a few rows of data.
Using an intermediate array
Whichever way the data are provided, they are stored in an array. The following procedure is suitable for transforming the array into a time series.
- Make a scalar variable (i.e. not an array) whose value is to change each time-step.
- Draw an influence from the time-series array to the scalar variable.
- Set the equation for the scalar variable to:
element([time_series], time()+1)
where [time_series] is any array that is being used to store values for the time-series.
This procedure selects one value from the array, in the row corresponding to the current simulation time. Note that in the sub-expression time()+1, the +1 is to account for array indices starting at 1, whilst the simulation begins at time()=0.
Using a file directly
The following procedure is used:
- Create the file in comma-separated value (CSV) format.
- In your model, set the variable to be a "Variable parameter". You must enter maximum and minimum values here, to allow the parameter to be set using a slider.
- Build the model.
- From the File menu of the Run Control, select the "Parameters..." command. If you are using the single-window execution environment, there is also a toolbar button to display the parameter dialogue.
- From the resulting parameter dialogue box, click the "Get values from file" button (with the pencil icon) next to the variable name.
- Create a table in the usual way, with or without an index, depending on how the values in the file are distributed with respect to time. You will need an index if the values do not correspond to times 1, 2, 3 etc.
- Click OK.
- Click the reset (stop) button.
This last step is necessary to re-set the model to use the new parameters at zero time. If you do not do this, a warning will be issued. Note that the index can start from zero.
Time series values do not have to be at regular intervals - for example, if you give a variable parameter the time series:
#0: 1 #20: 2 #80: 3
then it will change on reset and at times 20 and 80 but keep its previous value (or respond to slider input) at other times.
Getting a time series to repeat
If you want your time series values to be used again after a certain period of time, there are two ways to do this. If editing the list directly in the file parameter dialogue, you can end it with, e.g.,
#100: restart
to cause the values to restart from 0 at time 100. This must be at the end of the line.
If you are loading the values from a .csv file, then the load file dialogue will include an entry box labelled "Wraparound at:" into which you can enter a time at which to restart the time series. Doing either of these will cause the time series to repeat indefinitely over the specified period as the model runs.