Main menu
You are here
Running models : Working with visualisation tools : Lollipop
Lollipop diagram helper
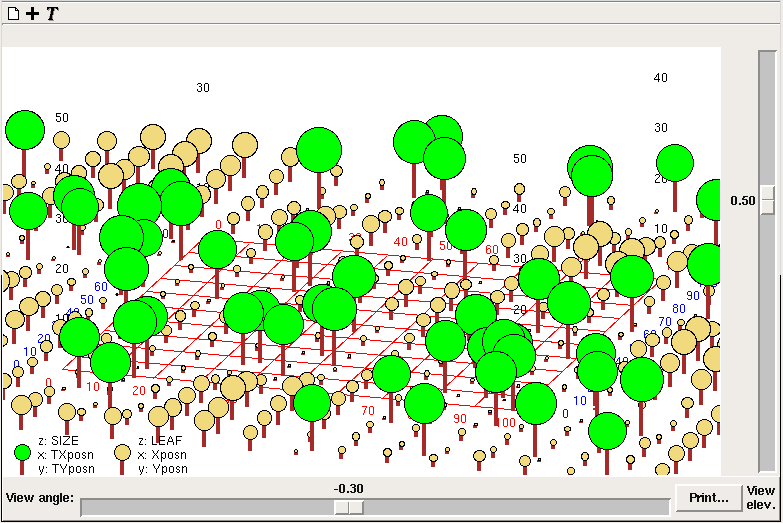
The "Lollipop diagram" is a means of displaying tree-like objects distributed in two dimensions. Each object has a size, which is used to calculate both the length of the trunk and branches. After invoking the helper, three variables are required for each component whose values are to be displayed, corresponding to the x-coordinates, the y-coordinates and the sizes. These can be variables or compartments, and are typically in a multiple-instance submodel. One tree then corresponds to each instance of the submodel.

Each set of values is displayed as trees of a diferent colour. A horizontal grid is also drawn, with x positions numbered in red, and y positions in blue. Numbers corresponding to heights of trees (z variable in the legend) are positioned above the grid corners in black.
There are sliders to adjust the longitude (view angle) and latitude (view elev.) of the point on an imaginary sphere surrounding the grid from which it is viewed. The image can be printed.
Note that all three variables can change through time, so although real-world trees may not move, their graphical representations can. This means the lollipop diagram helper can also be used for simulating animal movements, and so forth.
For best results, the x- and y-coordinates should be scaled between 0 and 100, and the size should be less than 25.
In: Contents >> Running models >> Working with helpers
- Printer-friendly version
- Log in or register to post comments
