2. Age classes, with a separate compartment for each age class
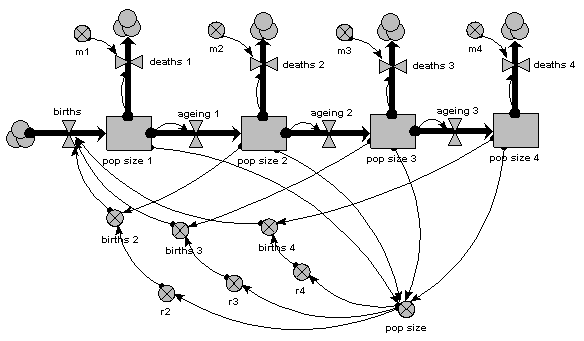
The same population is now represented by four compartments, one for each of four age classes. The first one represents the first year group, the second represents the number of animals aged 1-5 inclusive, the next animals aged 6-15 inclusive, and the fourth for all remaining animals. As before, the mortality rate per animal is independent of population size, but now depends on its age (there is a different m value for each age class). The reproductive rate per individual is still influenced by total population size, as well as now being different for each age class. Note that the first age class does not reproduce, so we simply do not include its reproductive rate.

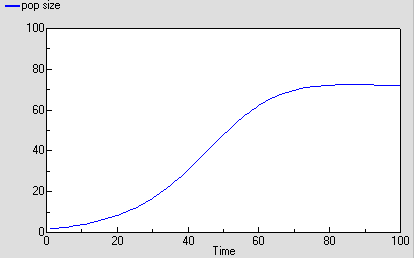
As before, we can now run the model and plot the dynamics of the total population size: this is in the variable called “pop size”, which is simply the sum of the population sizes for each age class. This again shows logistic growth: it will differ in detail, since the single-valued parameters we had before are now different for each age class.

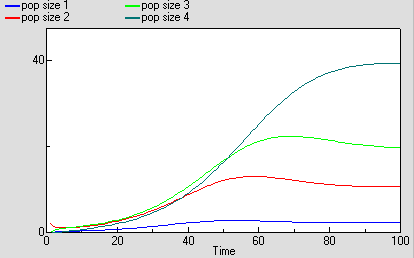
But we are now able to inspect the dynamics for each of the four age classes. We see that the stable total population size is reflected in stable numbers in each of the four age classes, with different numbers in each class reflecting their different population parameters. Notice that there is some overshoot before the stable values are reached.
