4. Age classes, using a multiple-instance submodel and an association model
The previous method is a big improvement: it is a much more concise way of representing multiple age classes, and exactly the same model can be used regardless of the number of classes we have: in other words, it scales up to larger problems. However, it suffers from a couple of disadvantages:
- There is a problem with the amount of data flowing around. Let’s say that we have 100 classes. Then Simile has to handle 100x100 values, since it has to make the array holding the 100 values available to each of the 100 classes. This is actually manageable, but still involves a lot of unnecessary computation (when we consider that in fact that there are only 100-1 = 99 interactions between classes, one for each pair of ageing transitions).
- Our model diagram does not really convey the fact that there is a special relationship between classes, namely that one class is immediately above the previous one. Class 2 is above class1, class 3 is above class 2, and so on. There is no connection between class 1 and class 3. Since this is an important feature of our model, and since one aim of the model diagram is to convey information about the model design down to a certain level, it would be nice if the model diagram showed that some form of relationship existed between classes.
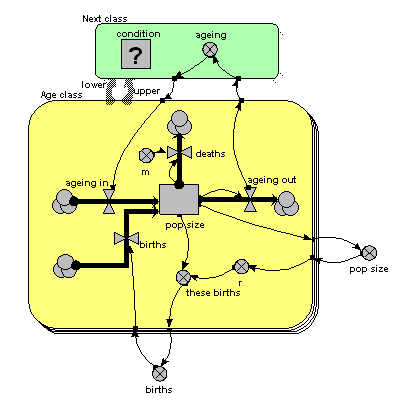
Simile’s association submodel provides a way for tackling both problems. This is quite a big step in your understanding of Simile if you have not come across it before, particularly if you have no background in relational databases or the concept of “association” in object-oriented software engineering. So all I will do here is to present the model diagram and talk you through that: an explanation of the equations used can wait until you actually come to use it.

The only difference from the previous model is that the single array variable, holding all the ageing flows from one age class to the next, has been replaced by am ageing variable inside another little submodel, called “Next class”. This is made with Simile’s submodel tool, just like any other submodel. It is, however, different in two respects from other submodels. First, it has two broad grey arrows pointing to it from the “Age class” submodel. These indicate that there is an “next class” relationship (or “association”) between one class (the lower one) and another (the upper one). Second, we see that the submodel contains a condition element: this is used to specify the condition under which the “next class” relationship holds true. In fact, it holds true if, and only if, the instance number of one class is just one higher than that of another class: that condition is entered in the Equation box for the questionmark symbol.
What happens is that all the values for “ageing out” are passed to the submodel, but only one value is passed back into the submodel for each class: the one for the class above it.
You will have noticed that the model diagram does not itself tell us just what relationship exists between classes. However, it does tell us that some sort of relationship exists between them, so the diagram has helped in communicating the nature of the model down to a certain level. This is rather like when we have a variable with influences on it: we can see that the influences exist, without seeing the actual equation used to capture their effect.