Scripting: automating simulation runs
This section deals with using SimileScript to automate simulations, ie runs of a model.
Optimizing model output
This is a simple example of optimizing output of a Simile model using SimileScripting and the Tcllib optimization package math::optimize. The script illustrates how to tackle this kind of problem.
"The package math::optimize is fully implemented in Tcl and no particular attention has been paid to the accuracy of the calculations. Instead, the algorithms have been used in a straightforward manner."
The script uses the procedure ::math::optimize::min_bound_1d that miminizes a function of one variable in the given interval. The procedure uses Brent's method of parabolic interpolation, protected by golden-section subdivisions if the interpolation is not converging. No guarantee is made that a global minimum is found. In the script the proceedure func is defined for ::math::optimize::min_bound_1d to evaluate. Proc func wraps up some SimileScript code that sets the input parameter value, resets the model and then runs the models. Finally it returns the value of a Simile model value for procedure ::math::optimize::min_bound_1d to minimize.
The package math::optimize also contains the procedure ::math::optimize::nelderMead that minimizes, in unconstrained fashion, a function of several variable over all of space, which may be worth experimenting with.
The model
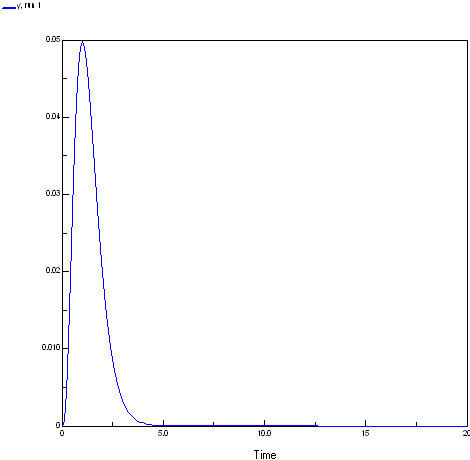
Model mathOptimize
			Enumerated types: []

		Variable   x
			x = 		Variable parameter
			Minimum = 0, Maximum = 10

		Variable   y
			y = 		x^3* exp(-3.0*x)
The response function of the model is shown below. To produce the plot the x values were set to the current simulation time.
The script
This script optimises the model output at the end of a run varying one input parameter. The script depends on math::optimize and uses the Plotchart package for a simple plot of the function output for a regular series of inputs the easiest way to get these package is probably to install ActiveTcl.
http://www.activestate.com/products/activetcl/
# This works to optimise for the last value of models runs.
	# The model is run for a set period (SetExecuteFor) and a parameter is set
	# to a given value at the start of the run.
	#

	# this script depends on math::optimize and uses the Plotchart for a
	# simple plot of the function output for a regular series of inputs
	# the easiest way to get these package is probably to install ActiveTcl
	# http://www.activestate.com/products/activetcl/


	# Where the extra libraries live MODIFY FOR YOUR CASE
	lappend auto_path {c:/program files/tcl/lib}; # eg ActiveTcl directories

	package require math::optimize
	package require Plotchart

	# Simulistics provided package
	package require SimileAutoObj; # not actually needed in Windows using SimileScript.exe


	# Create a Tcl object/command (modelWin) with which to control that instance of Simile
	similescript::ModelWindow modelWin

	# Tell Simile not to use the single window Model Run Environment
	# We are not going to use any helper anyway here.
	# We then load the model and build it using C++
	modelWin UseMRE false
	# MODIFY FOR YOUR CASE      MUST BE FORWARD SLASHES EVEN UNDER WINDOWS!
	modelWin Open "H:/mathOptimize.sml"
	modelWin Run


	# Create a runControl command/object with which to control
	# (as you might expect) the run control.
	similescript::RunControl runControl

	runControl SetExecuteFor 1
	runControl SetTimeStep 1 1

	# Create proc to run model and return value of variable to optimize
	proc func {x} {
	    runControl SetValue /x $x
	    runControl Reset
	    runControl Start
	    # multiply the value by -1 as we want the maximum value using a minimising optimiser
	    set y [runControl GetValue /y]
	    return [expr -1*$y]
	}

	package require Plotchart

	toplevel .t
	canvas .t.c -background white -width 400 -height 200
	pack   .t.c -fill both

	#
	# Create the plot with its x- and y-axes
	#
	set s [::Plotchart::createXYPlot .t.c {0.0 20.0 2.0} {0.0 0.05 0.01}]
	$s title "Shape of function we are evaluating"

	# evalute the model output for a range of input values ()
	# by plotting the output value for a series of input values
	# # multiply the value by -1 to get the original sign
	puts "Function shape"
	for {set i 0} {$i<=20} {incr i } {
	    set x [expr {$i/2.0}]
	    set y [expr {-1*[func $x]}]
	    puts "$x $y"
	    $s plot series1 $x $y
	}

	#puts "Maximum at(negative y value): [::math::optimize::min_bound_1d func 0.0 10.0]"
	set results [::math::optimize::min_bound_1d func 0.0 10.0 -trace on]
	set x [lindex $results 0]
	set y [expr {-1*[lindex $results 1]}]
	puts #####################################################
	puts {::math::optimize::min_bound_1d func 0.0 10.0}
	puts "Maximum at: $x = $y"
	puts #####################################################
	puts ""

	set results [::math::optimize::min_unbound_1d func 0.2 0.7 -trace on]
	set x [lindex $results 0]
	set y [expr {-1*[lindex $results 1]}]
	puts {::math::optimize::min_unbound_1d func 0.2 0.7}
	puts #####################################################
	puts "Maximum at: $x = $y"
	puts #####################################################
Results
You can see its search for the minimum if the trace is on:
(Run) 159 % ::math::optimize::min_bound_1d func 0.0 10.0 -trace on
	f(3.8196601125) = -0.000588169133818 (initialisation)
	f(6.1803398875)=-2.09302565156e-006 (golden section)
	f(2.360679775)=-0.0110514849929 (golden section)
	f(1.4589803375)=-0.039018178181 (golden section)
	f(0.901699437495)=-0.0490203182137 (golden section)
	f(0.178385003365)=-0.0033239934159 (parabolic interpolation)
	f(0.625417908211)=-0.0374683267348 (golden section)
	f(1.05516631149)=-0.0495683007526 (parabolic interpolation)
	f(1.01193600577)=-0.0497765137855 (parabolic interpolation)
	f(1.00189882668)=-0.0497867994449 (parabolic interpolation)
	f(0.99971913441)=-0.0497870624755 (parabolic interpolation)
	f(0.999993651474)=-0.0497870683649 (parabolic interpolation)
	f(1.00000018344)=-0.0497870683679 (parabolic interpolation)
	f(0.999999991611)=-0.0497870683679 (parabolic interpolation)
	f(0.999999891511)=-0.0497870683679 (parabolic interpolation)
	f(0.999997508029)=-0.0497870683674 (golden section)
	f(0.999998981102)=-0.0497870683678 (golden section)
	f(0.999999543765)=-0.0497870683678 (golden section)
	f(0.999999758684)=-0.0497870683679 (golden section)
	f(0.999999658584)=-0.0497870683679 (golden section)
	0.999999658584 -0.0497870683679
Maximum at: 0.999999658584 = 0.0497870683679
Files
- Simile model MathOptimize.sml
- SimileScript MathOptimize.tcl
Tcl Tutorial and other links: SimileScript is an extension of Tcl
You don't need to have an in-depth knowledge of Tcl to automate running Simile models using SimileScript. Generally if you have some scripting or programming experience you will be able to adapt one of the examples scripts (in the "examples" subfolder of your Simile directory). However, to understand fully what's going on in the examples you will need some more information on Tcl.
Furthermore, Tcl is a powerful language with many extensions. Powerful enough to be used for application programs, indeed the Simile user interface is written in Tcl (with Tk the graphical toolkit). If you wish, your SimileScripts may be far more powerful and complicated than the simple examples included with the Simle installation.
- Tcl Tutorial (NB the SimileScript program (with Simile for Windows), or Wish in the Simile installation bin folder for other operating systems, should be used instead of tclsh as directed in the tutorial.)