Working with model diagrams
Working with model diagrams
Working with the model diagram is the heart of the modelling process. The model diagram is a graphical representation of the all the elements and relationships within the system being modelled. Using the model diagram elements, and the tools described here, an infinite range of models can be created. All work on the model diagram uses a selection mechanism to determine the elements affected.
|
|
|
|
|
|
|
|


There are four tools for manipulating the elements of the model diagram.
|
|
Selecting, in order to duplicate, move, delete or label elements |
|
|
|
Dragging the canvas around inside the viewport to show different parts of the model (this can also be done with the scrollbars or mouse wheel) | |
|
|
||
|
|
||


The following tools are provided for convenience in working with model diagrams
|
|
|
|
|
|
|
|
|
 |
Aligning symbols on a grid |
|
|


The following advanced topics are dealt with separately.
|
|
|
|
|
Customizing the diagram's appearance |
|
|
|
|
|
|
|
|
|
|
|
|
|
|
In: Contents
Working with model diagrams : Adding node-type elements
Adding node-type elements
The node-type elements are:
- the
 variable
 - the
 compartment
 - the
 event
event - the
 state
state
as well as the elements used in population submodels. The T text box and  image element also behave as node-type elements, though no node is associated with them. The following procedure is used to add node-type elements.
- Click on the required node symbol in the tool bar.
- Click on the diagram canvas where you want to place the element.
- At this point the caption is selected and you can type in your chosen caption (except for images).
- Repeat (2) if you want to add more nodes of the same type.
Note that the button you selected on the tool bar remains depressed until you select another button (i.e. to add a different element, or to change into a different mode, such as label or move). This allows you to add quickly several elements of the same type.
There are other methods if you want to add just one element without leaving pointer mode. Any of the following will add a single element to the diagram:
- Drag from the tool bar symbol to the chosen place on the diagram.
- Right-click at the chosen place on the diagram, and in the context menu select "Create New" -> your chosen node type. The population submodel membership controls are listed in their own submenu.
However you add a node, it appears with a default caption, e.g., "comp33". Since this caption is rarely what it needs to be in the finished model, it is selected for editing when the node is added, so you can immediately type in a more appropriate one, e.g., "Bananas".
Note that it is not possible to add a node-type element to an area of your diagram that is already occupied. A warning message appears, so if this happens, simply click somewhere else where there is sufficient space, or  move existing elements around to make sufficient space. You can also adjust the relative size of components in a submodel to make more room around them.
Working with model diagrams : Adding arrow-type elements
Adding arrow-type elements
The arrow-type elements are the ![]() influence,
influence, ![]() flow,
flow,  squirt and
 ![]() role arrows. In general, arrows link two nodes, though there are exceptions, as explained below. There are two methods of adding arrow-type elements.
role arrows. In general, arrows link two nodes, though there are exceptions, as explained below. There are two methods of adding arrow-type elements.
- Click on the required arrow symbol in the tool bar.
- Drag the mouse from the place where you want the arrow to start, to the place where you want it to end. If you drag outside the model window during this operation, it will be scrolled in that direction bringing more space into view.
- Repeat (2) if you want to add more arrows of the same type.
Alternatively,
- Click on the required arrow symbol in the tool bar.
- Click on the place where you want the arrow to start. The cursor becomes a 'cross-hairs' indicating another click on the diagram is needed to finish adding the link.
- Click on the place where you want the arrow to end. If you miss the exact point, you can keep the button down and drag to it. If you drag outside the model window during this operation, it will be scrolled in that direction bringing more space into view.
- Repeat (2) and (3) if you want to add more arrows of the same type.
Note that the button you selected on the tool bar remains depressed until you select another button (i.e. to add a different element, or to change into a different mode, such as label or move). This allows you to add quickly several elements of the same type.
You can also add a single link using either of the methods you would use to add a single node without changing mode, i.e.,
- Drag from the link's toolbar symbol to the start point on the diagram, or
- Right click at the start point to get the context menu, and select "create new" followed by the link type.
Either of these actions sets the cursor to 'cross-hairs', requiring another click to set the end point of the new link.
Specific instructions for each type of arrow
 Flow and squirt arrow
A flow or squirt arrow must:
- begin in a blank area of the screen, and end in a compartment; or
- begin in a compartment, and end in a blank area of the screen; or
- begin in a compartment, and end in a compartment.
Note that if the flow or squirt arrow begins or ends in a blank area of the screen, Simile automatically adds the source/sink symbol (a cloud).
Note also that if you draw two flow arrows between the same two compartments in opposite directions, the arrows mainly lie on top of each other, but the valve (bow-tie or target) symbols are separated. You need to be careful that you know which valve symbol is associated with which arrow, when you come to add influence arrows or equations to the flows. You may like to use the ![]() move tool to drag the ends of the flows around one of the compartments to separate them from one another.
move tool to drag the ends of the flows around one of the compartments to separate them from one another.
 Influence arrow
An influence arrow must:
- begin in any model element (except a submodel or an influence arrow); and
- end in any model element (except a submodel or influence arrow).
There is an exception to this rule. If you have an influence arrow coming from an input variable inside a submodel to some element (E1); then it is legal to draw an influence arrow from some other element (E2) to this influence arrow. The effect of this is to eliminate the input variable and to cause the influence arrow to go directly from E2 to E1.
Note that if you should accidentally miss the target model element, then the influence arrow will go shooting off to the edge of the model diagram window or submodel boundary. If that happens, then simply click on the ![]() undo button in the toolbar, and try again. The reason for this behaviour is to allow you to add placeholders for influence arrows to be taken from submodels. Drag an influence arrow from the placeholder on the submodel boundary, to the desired element outside the submodel to complete the link.
undo button in the toolbar, and try again. The reason for this behaviour is to allow you to add placeholders for influence arrows to be taken from submodels. Drag an influence arrow from the placeholder on the submodel boundary, to the desired element outside the submodel to complete the link.
Multiple influences coming from a variable in a submodel to variables outside it will share a common link as far as possible. So will multiple influences coming from a variable outside a submodel to variables inside it. This makes for a much neater diagram when there are lots of influences. However, this can cause odd behaviour when the influences point to variables on opposite sides of the submodel. You can usually fix this by selecting the ![]() move tool from the toolbar, and dragging the attachment point around the submodel boundary.
move tool from the toolbar, and dragging the attachment point around the submodel boundary.
 Role arrow
A role arrow must:
- begin in a submodel; and
- end in a submodel.
Working with model diagrams : Adding submodels
Adding submodels
The following procedure is used to add a submodel to the model diagram.
- Click on the
 submodel symbol in the tool bar.
 - Drag the mouse from a blank area of the desktop canvas, corresponding to one corner of the submodel envelope, to the opposite corner of the area that you want to be enclosed in the submodel envelope. If you drag outside the model window during this operation, it will be scrolled in that direction bringing more space into view.
- Repeat (2) if you want to add more submodels.
Alternatively,
- Click on the submodel symbol in the tool bar.
- Click on the place where you want to put one corner of the submodel envelope. The cursor becomes a 'cross-hairs' indicating another click on the diagram is needed to finish adding the link.
- Click on the opposite corner of the area that you want to be enclosed in the submodel envelope. If you miss the exact point, you can keep the button down and drag to it. If you drag outside the model window during this operation, it will be scrolled in that direction bringing more space into view.
- Repeat (2) and (3) if you want to add more submodels.
You can also add a single submodel using either of the methods you would use to add a single node without changing mode, i.e.,
- Drag from the submodel symbol to the first corner point on the diagram, or
- Right click at the corner point to get the context menu, and select "create new -> submodel".
Either of these actions sets the cursor to 'cross-hairs', requiring another click to position the diagonally opposite corner of the new submodel.
Note that the submodel you make may, or may not, enclose existing model elements. Simile will not allow you to add a submodel with the boundary passing through an existing component other than a link. When making a submodel, you can either make it to enclose some existing model elements, or it can begin life empty, with the intention of adding elements later on. The following notes apply to the two situations:
Submodel is drawn around existing model elements
The elements must be arranged so that it is possible to enclose them in a rectangle without enclosing any elements you don't want in the submodel. You may need to move them around prior to drawing the submodel envelope to achieve this. The elements are then deemed to be enclosed inside the submodel. Any links coming from outside this new submodel to elements inside it, or vice versa, will be redrawn to show a crossing point at the submodel boundary.
Submodel does not enclose existing elements
You need to find an empty area of your model diagram that is big enough to contain the new submodel. You may need to move existing model elements around in order to create some space.
Working with model diagrams : Selecting model diagram elements
Selecting model diagram elements
The selection mechanism is straight-forward. First select one or more elements on the model diagram, then perform an action on the selection.
To select a single element, click on it using the pointer. To continue to select further elements, hold down the Ctrl key (Cmd key on the Mac) whilst clicking on them. If you select an element by mistake, click on it again with the Ctrl key held down, and it will be unselected, leaving the rest of the selection unchanged. To abandon a selection altogether, click in a blank area of the diagram, outside any selected submodels. To select multiple elements at once, drag the pointer across the area containing them: a marquee (rectangular selection) will be drawn around the elements that are included in the area. If you drag outside the model window during this operation, it will be scrolled in that direction bringing more space into view. The elements will all be selected when the drag is released. If any part of an element (other than the caption) is included in the area, it will be included in the selection. If you drag a marquee around some elements while holding the Ctrl key down, any elements in the marquee that were not already selected will be added to the selection. You cannot unselect elements by ctrl-dragging.
The context menu contains the commands "Select all", "Unselect all" and "Invert selection". These apply within the submodel in which you right-click to display the menu, and any submodels nested within it.
Selected components and captions will be highlit in blue. Links between selected components are also highlit in blue, while links between selected and unselected components are green. These green links will stretch if the selection is moved, and will be deleted if it is cut, but will not be put on the clipboard.
Ghosts of selected components, and base components of selected ghosts, will be highlit in bright green. It is also possible to have components connected to the selection highlit like this. Under the "View" menu, select "Highlight back" -> "One level". Now all components starting influences going to the selection, including via ghosts, are highlit. There is also the option to highlight back two or three levels, and an equivalent choice for highlighting forwards, which shows up components influenced by the selection. Components that are highlit in this way are not affected by actions done on the selection.
Various actions can be performed on selected element(s). The actions are available in the context menu, invoked with a right click. Once one or more elements are selected, the action chosen from the context menu will be performed on the selection, wherever the mouse is when the right-button is clicked.
The selection can be cut or copied to the clipboard. If you paste the clipboard into another program, such as Microsoft Word, a picture (metafile) will be shown in the document. If you paste the clipboard into Simile, the elements will be inserted, complete with functions and other properties.
In: Contents >> Working with model diagrams
Working with model diagrams : Duplicating elements
 Duplicating elements
You can make multiple copies of one or more elements. This can be quick when some parts of your model are similar to one another. Follow these basic steps.
- Click on the
 pointer tool on the tool bar.
 - Click to select the element you wish to copy. If you wish to copy more than one element, hold down the Ctrl key whilst selecting the elements.
- Use the context menu (right-click)
 copy and
  paste commands.
The selected elements will be duplicated into an area where there is sufficient space to receive them. The elements will also receive new valid names to avoid clashing with the existing selection. The elements are selected ready to move to the desired position together.
Important! You should not need to duplicate groups of elements multiple times in Simile -- if you find yourself doing so, think about using a multi-instance submodel instead.
Working with model diagrams : Moving elements
 Moving model diagram elements around
You will inevitably want to change the layout of the elements in your model diagram. For the elements you have placed on the diagram yourself, such as compartments and variables, you will find that at some stage you need to move them around, to make the diagram neater, easier to understand, etc. For some elements, such as the route taken by arrows and the placement of labels, you will want to arrange them to suit yourself: perhaps an influence arrow goes behind a compartment, or two labels run together.
The basic steps are:
- Select the
 pointer tool if not already selected.
 - Move the mouse to the element you wish to move.
- Click to select the element.
- Drag the element to the new position.
For node-type elements, the effect is pretty obvious. But note that:
- All arrows are sticky, so that moving any node-type element causes all the arrows associated with it to move around, according to the built-in arrow pathway algorithm.
- Nodes cannot be moved into space occupied by other nodes. However, if you keep on dragging past an obstruction, then the element you are moving will leap into position as soon as there is sufficient free space.
Special considerations apply to the following elements:
Working with model diagrams : Moving labels
Moving labels
You can move a label for a model element independently of moving the element itself. (I.e. if you move the element, the label keeps the same relative position; but if you move the label, then only the label moves - the element doesn't.)
There is no constraint on where you move the label to, so it is possible for the label to be visually far removed from the element that it is labelling. You can also move the label to be inside the element: e.g. a compartment label inside the compartment, or a submodel label inside the submodel rather than (by default) just outside it. Clicking on either the label or the element will highlight both, which is useful if you reach a situation where it is not obvious which label goes with which element.
To move a label relative to its element, the element itself must not be selected. If the element is selected, then dragging the mouse across the label will select the text of the label, allowing you to edit the label. To move the label instead, click in a blank area of the diagram or choose "Unselect all" from the context menu to ensure that nothing is selected, and then drag the label to its new position.
In: Contents >> Working with model diagrams >> Moving model diagram elements
Working with model diagrams : Moving flow or squirt valve symbols
 Moving flow or squirt valve symbols
If a flow or squirt arrow has a "kink",you can adjust the position where this is drawn by clicking on the middle section, well away from the bowtie symbol, and dragging it along the length of the rest of the flow. In other cases, you cannot change the actual path taken by a flow arrow. However, you can always change the position of the valve (bowtie or target) symbol on the arrow, by dragging it along the arrow in the desired direction. You can also move the cloud associated with flows or squirts, generating a corresponding re-alignment of the route.
If you draw two flows between the same two compartments in the same direction, then the second one may partially overlap the first, including the valve symbol. You can move one or both valve symbols or kinks to enable each to be handled separately.
If you draw two flows between the same two compartments in opposite directions, then the flows may partially overlap, but the valve symbols will not, so that you do not have to move them for each one to be visible.
In: Contents >> Working with model diagrams >> Moving model diagram elements
Working with model diagrams : Moving influence arrows
 Moving influence arrows
With influence arrows, you can change the route taken by the arrow. Simply drag any part of the arrow, and the whole arrow will be redrawn along a new curve.
Where an influence arrow is broken into several segments, as it traverses submodel boundaries, each segment is treated independently. Thus, dragging one segment only affects that segment. Dragging a node at the start or end of the influence arrow likewise only affects the first or last segment.
You can move the dot where the influence arrow crosses a submodel boundary. This changes only the two segments that enter or leave the dot. Click on the dot or on the arrow head connected to it, and drag around the boundary. It can be quite hard to select the dot/arrowhead for moving rather than the link shaft on either side.
In: Contents >> Working with model diagrams >> Moving model diagram elements
Working with model diagrams : Moving role arrows
 Moving role arrows
Role arrows can be moved in the same way as influence arrows, by dragging any part of them. Note that as for influences, the endpoints of a role arrow cannot be moved as such; the effect of dragging them is the same as that of dragging any other part of the arrow.
When a relation arrow crosses several submodel boundaries then, as with influence arrows, the effect of such changes are local to a given segment of the relation arrow. You can drag the blobs that are drawn where they cross intermediate submodel boundaries, and this will affect the routes of the sections either side of that boundary.
Two role arrows that connect the same pair of submodels cannot be positioned directly on top of one another.
In: Contents >> Working with model diagrams >> Moving model diagram elements
Working with model diagrams : Moving and re-sizing submodels
 Moving and re-sizing submodels
The following rules govern the behaviour of the  move tool, when applied to submodels.
- dragging in any blank area of a submodel moves the whole submodel and all its contents, if the submodel is selected;
- dragging the submodel boundary resizes the submodel by moving the boundary that is dragged; and
- dragging a corner of the submodel resizes the submodel in both the horizontal and vertical directions.
If a submodel is not selected (i.e. the boundary is not drawn blue) then dragging in a blank area within the submodel draws a rectangular marquee for selecting elements within the submodel. Only if the submodel is selected, is it possible to move it by dragging.
When moving or re-sizing a submodel, there must be sufficient area of blank canvas (with no obstructing elements) available.
Note that it is not possible to move an element across a submodel boundary, or vice versa. This is because such a move would change the actual semantics (mathematical properties) of the model, which "move" operations generally do not. It is necessary instead to cut the element (or group of elements) from one side of the boundary, and paste them in the other. This will cause any links between the element(s) and other parts of the model diagram to be broken, and they must be added again individually.
If a lot of elements are to be moved in or out of a submodel, it may be easier to delete the submodel boundary and redraw it around a different group of components. Any special properties of the submodel, e.g., dimensions, will have to be set again when it is re-created.
In: Contents >> Working with model diagrams >> Moving model diagram elements
Working with model diagrams : Moving groups of elements
Moving groups of elements
To move a group of elements while keeping them in the same places relative to each other, select the whole group as described in Selecting model diagram elements, then click on any selected element, or inside any selected submodel, and drag. It must be a fully selected element (not a highlit link connecting a non-selected element) and only components inside the same submodel as the dragged component will be moved.
Movement will stop if any component in the group being moved collides with another component. In very complex models, moving large groups of components may cause Simile's graphics to respond slowly as it redraws highlit links and checks for collisions. If this becomes a problem, use the preferences dialogue to choose "Quick drag" as described in Preferences: Edit. This turns off collision detection and link updating during a drag, allowing the graphics to run at full speed. In this mode, link re-routing and collision detection are done only when the group is dropped at the end of the drag. If the move results in elements overlapping, or ending up in a different submodel from where they started, the selection will return to where it was at the start of the drag.
Working with model diagrams : Deleting elements
 Deleting elements from the model diagram
To delete elements from the model diagram, follow these basic steps:
- Click on the
 pointer tool of not already using it.
 - To delete a single element, right-click on it.
- To delete multiple elements, first select them, then right-click on any selected element (or click on "Edit" in the menu bar)
- In the context menu, choose the "delete" command.
You can also delete the selection by hitting the "delete" key.
Please note
If you should accidentally delete something, then the  Undo tool will bring it back again.
Working with model diagrams : Changing labels
Changing the label for elements on a model diagram
To re-label any element in the model diagram:
- Click on the
 select tool on the toolbar.
 - Select an element in the model diagram, or a group of elements whose labels you wish to change.
- Click on the label of a selected element to change it, or drag across the label to select some text for cut/copy/delete.
- Use the Backspace or the Delete key to remove the existing label.
- Type in the label you wish for this model element. You can use any characters from the keyboard, including spaces, capital letters, the RETURN character and special characters, except for the period ( . ), the forward slash ( / ) and the reverse slash ( \ ).
If you try to change a label to one that already exists in the same submodel, or you use illegal characters in the label, or only use whitespace in the label so it cannot be seen, then Simile will generate an error message and leave the label unchanged. However any label is allowed for a T text element.
Suggestions
- Using the RETURN character is a good way of avoiding having long labels that stretch across the model diagram.
- You should choose labels that to some extent make the model diagram self-documenting: someone who is knowledgeable about the subject area of the model should be able to read the diagram and have a good idea of what most of the labels mean.
- However, remember that the labels are (by default) the names of the variables used in equations. Therefore, you should avoid labels that are too long and wordy. (You can however provide your own local names for variables inside equations, so you can use long labels if you prefer.)
- Remember also that the full label for an element in the model diagram is the label that you give it, along with the labels of any submodel(s) that it is enclosed within. (This is just like file names: the name of a file is the name given to it, along with the names of all the directories it is enclosed within.) Therefore, if you have a biomass compartment in each of two submodels - say "animal" and "plant" - then it is quite acceptable to label each of the two compartments with the same label, "biomass", since one is "plant/biomass" and the other is "animal/biomass".
- Choose names that reflect the type of element that you are re-labelling: see below.
Appropriate types of label for different types of model element
 Compartments
The label should reflect the fact that this is (usually) referring to an amount of something. Thus, use terms like biomass, area or numbers.
 Flows
Flows
The label should reflect the fact that the a flow is (usually) some process. Thus, use terms like production, growth, reproduction.
 Simple submodels
The label should reflect the subsystem being modelled, for example, "vegetation".
Multiple-instance submodels (fixed-membership and population submodels)
The name should reflect one instance of the type represented by the submodel. Thus:
- if you are modelling a stand of trees, then the submodel should be called "tree";
- if you are modelling an area as multiple patches, then the submodel should be called "patch";
- if you are modelling multiple size classes, then the submodel should be called "size-class".
i.e. use the singular, not the plural. The reason for this is that the submodel represents a single individual: the fact that there is a set of them is indicated by the appropriate setting in the Properties box for the submodel: it is not an intrinsic property of the submodel itself.
Association submodels
The label should reflect the type of association that exists between the two types of object involved in the relation. Thus:
- if the association submodel represents ownership between people and patches of land, then label it "ownership";
- if the association submodel represents the fact that some spatial units are next to others, then label it "next to".
 Role arrow
The label should reflect the role of the object in the association. Thus, if the association submodel is used to represent ownership of patches of land by people, then the role arrow coming from the person submodel should be labelled "owner", and the role arrow coming from the patch submodel should be labelled "owned".
Working with model diagrams : Create ghosts
 Creating ghost elements
Large diagrams can become unwieldy, due to the long distances across which influence arrows must be drawn. To work around this, it is possible to create a ghost of a node element, which has the same value at all times as the original. The ghost can be placed close to the other element(s) that the original element influences. A ghost can be recognised by its appearance (ghostly).
A single original element can be ghosted more than once, each ghost being placed closer to other elements. Influence arrows and flows can be drawn to and from ghosts as usual. These will affect all instances of the original. To create a ghost, the following procedure is used:
- Click on the ghost button on the tool bar, or select the "Ghost" item on the "Tools" menu.
- Click on the element to be ghosted. The cursor now takes on a 'cross-hair' appearance, indicating another click is needed to complete the operation.
- Click on the model diagram to place the ghost. If you click on an existing element on the model diagram, it will become the ghost. If you click in a blank area, a new symbol will be placed there.
Alternatively, you can:
- Click on the ghost button on the tool bar, or select the "Ghost" item on the "Tools" menu.
- Drag from the component to be ghosted, to the location of the new ghost.
Once a ghost is created, changes to its equation or other properties will also affect the original, and other ghosts created from the same original. Care must be taken in using ghosts as it is easy to overlook the fact that a ghost exists elsewhere and will be affected by changes made to the original which are not appropriate for the ghost. When a component is selected, all its ghosts are highlit in bright green.
There are implied influence arrows between the original element and its ghost. You can turn on the display of these influence arrows, in order to find all related ghosts for example, using the "Show detail… Ghost links" command of the View menu. Once the ghost links are displayed, they can be deleted, in which case the component at the end ceases to be a ghost, and is marked incomplete (red) unless it has an equation of its own.
It is sometimes useful to replace a component in one part of a model with the ghost of another, allowing the value of the ghosted component to be used everywhere the value of the original component was previously used. To do this, you can click on, or drag to, another component when creating a ghost. The component becomes a ghost, keeping all its connections. For this to happen it must be the same type as the component being ghosted. The original equation of the replaced component is remembered, and reappears if it ceases to be a ghost.
Note that if you delete the original element, all its ghosts will become undefined unless they previously had equations of their own. You can delete a ghost without affecting the original, unless you have added influence arrows or flows to the ghost, in which case these will no longer be used by the original.
Working with model diagrams : Printing
 Printing model diagrams
To print a model diagram, either select the "Print…" option on the "File" menu, or click the ![]() button on the tool bar. Either command will invoke the print dialogue box, which allows you to select a printer, choose the number of copies, and change printer settings, such as printing in portrait or landscape orientation.
button on the tool bar. Either command will invoke the print dialogue box, which allows you to select a printer, choose the number of copies, and change printer settings, such as printing in portrait or landscape orientation.
The model diagram is scaled to fit on a single sheet of paper.
Working with model diagrams : Undoing and redoing changes
Undoing and redoing changes to the model diagram
A record is kept of the last 32 changes you have made to the model diagram, including operations like adding new elements, deleting, moving and renaming elements, and entering or changing a value or equation.
 Undo
Undo
The Undo button on the toolbar and the Undo command on the Edit menu reverses the effect of the preceding operations in turn (up to a maximum of 32). You must undo operations in sequence, it is not possible to undo an earlier change without also undoing all subsequent changes.
 Redo
Redo
The Redo button on the toolbar is, in effect, an un-undo button: it reverses the effect of a preceding click on the Undo button. As with the Undo button, you can Redo any number of Undo's (up to the maximum of 32). However, note that the Redo button is only activated immediately after a click on the Undo button. If you click on Undo, then do something else (like add a new compartment), then the Redo button is greyed out and you can no longer use it.
Working with model diagrams : Zooming in and out
Zooming in and out
You can zoom in and out of a model diagram. Zooming in makes the symbols bigger but shows less of a large diagram. Zooming out shows more of the diagram but makes the symbols smaller.
There are two methods for zooming:
- using the Zoom... item in the View menu
- using the Zoom buttons on the toolbar
Zooming using the "Zoom..." item in the View menu

|
In lots |
2x scaling: symbols are doubled in (linear) size. |
|
In a bit |
approx. 1.25x scaling: symbols are slightly bigger |
| To selection | Scales and scrolls the diagram so the viewport fits around the selected nodes and submodels. This will not change the size or shape of the overall diagram. |
|
To fit |
Re-sizes the whole diagram so all components just fit the window. Note that this is according to the most constraining dimension, so the operation may add more whitespace to the overall diagram. Whitespace outside the viewport is trimmed from the diagram. |
|
Out a bit |
approx 0.8x scaling: symbols are slightly smaller. If the diagram shrinks below the size of the viewport, whitespace will be added around the edges. |
|
Out lots |
0.5x scaling: symbols are halved in (linear) size. If the diagram shrinks below the size of the viewport, whitespace will be added around the edges. |
Zooming using the Zoom buttons on the toolbar
 has an effect between the "Zoom...in a bit" and "Zoom...in lots" items in the View menu: it scales by approx. 1.4x, making the symbols larger and showing less of the diagram.
 has the same effect as the "Zoom...to fit" item in the View menu: see above for a detailed description of its behaviour.
 has the same effect as the "Zoom...to selection" item in the View menu: see above for a detailed description of its behaviour.
 has an effect between the "Zoom...out a bit" and "Zoom...out lots" items in the View menu: it scales by approx. 0.7x, making the symbols smaller and showing more of the diagram. Whitespace may be added.
Working with model diagrams: Aligning symbols on a grid
Aligning symbols on a grid
Simile's desktop area can display a grid of horizontal and vertical lines which is used to aid accurate placement of model components. The display of this grid is turned on or off by means of the toggle-grid button (![]() ) in the menubar. The functions of the grid can be activated whether or not it is currently being displayed.
) in the menubar. The functions of the grid can be activated whether or not it is currently being displayed.
Controlling grid appearance
The pitch of the grid (frequency of lines) and how heavy they appear on the desktop can be adjusted from the 'Layout' tab in the Preferences dialogue. There is also an option on this tab to select whether the grid appears initially in a new window.
Using the grid
The 'Edit' tab in the Preferences dialogue has a checkbox labelled 'snap to grid'. When this is checked, any component added to a model will 'snap' to the nearest grid intersection. When dragging a component, or dragging a submodel boundary, it will 'jump' between successive grid intersections or lines. This does not happen when dragging a link to change its route, when dragging a component's caption, or when dragging a bowtie along a flow.
Components that were previously placed higgledy piggledy can be aligned to the grid by selecting them, then choosing 'align to grid' from the Edit menu. This works whether or not 'snap to grid' is checked. Components are aligned on their parent submodel's grid. Note that if a submodel has a relative scale that does not go into 1 an exact number of times, then its internal grid will not match up with its parent model's grid.
Changing the grid pitch does not itself cause components to snap to the new grid; this must be done afterwards using Edit -> Align to grid.
Working with model diagrams : Searching for a particular element
Searching for a particular element
Navigating through large or complicated diagrams is made easier by the search facility. This will highlight the element you are looking for, and centre it in the window, if the model diagram extends beyond the window's edges. You can search for components by following connections around the diagram, or using text contained in their caption, equation or description and comments, using the "Find" tool.
The simplest way is to use the two tools provided on the toolbar:
 "Find" calls up a dialogue box into which you enter the text, and specify which text elements to search
 "Find Next" searches for successive occurrences of variables satisfying your search criterion
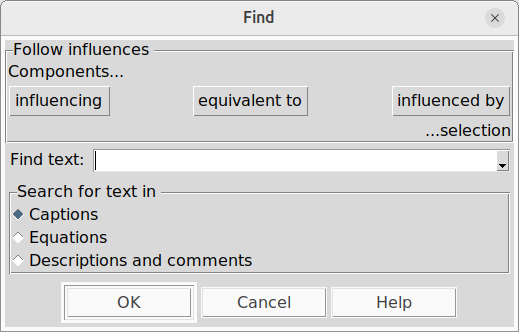
There are two search modes available in the dialog box:
- According to influence arrows and ghost relations in the model (selected by upper row of buttons)
- By looking for keywords in the text associated with components (selected by "OK" button)
Elements are searched in order, with the first to match the search conditions being highlighted. If this is not the one you want, or you want to find others that satisfy the same conditions, use the "Find Next" tool. Alternatively, you can choose the commands "Find..." and "Find next" on the Edit menu. "Find Next" will be available to continue to show the results of the last search until a new search is done. If you choose "Find..." from the context menu after right clicking in a submodel, the search will only turn up components within that submodel, even if you choose "Find next" somewhere else.
The description and comments associated with an element are entered using the equation dialogue window, as is the equation itself. The caption (or name) of an element is entered on the model diagram.
Note that the text is not case-sensitive, so "VAR" will mach "var". Note also that the text will match its use anywhere within the text elements searched, so "ar" will match both "car" and "arm". Also note that you cannot put a newline in the search string, as hitting the Return key starts the search. You can instead include \n (backslash-n) in the search string, and this will match a newline in the text being searched for.
Searching equations is a useful way to find where a particular function is used. For example, searching for the text "rand" in equations will find all the elements using the functions "rand_var" and "rand_const".
As well as searching for text, the search system can follow influences around the diagram, even when these come to and from ghosts of the starting point. To use this feature, first select one or more nodes in the diagram, then hit the "Find" button. The dialogue contains a "Follow influences" panel with three buttons, "Components influencing selection", "Components equivalent to selection" and "Components influenced by selection". If you hit the first of these, the selection will be cleared and a component which starts an influence arrow going to a previously selected component will itself be selected. Now you can hit either "Find next" to go to another component that influences the original selection, or "Find" followed by "Components influencing selection" to go to a component influencing the one you just went to. "Components influenced by selection" does the same thing but searches forwards along influences rather than backward, and "Components equivalent to selection" merely finds ghosts of selected components, or bases of selected ghosts.
Working with model diagrams : Rescaling symbol size in submodels
Rescaling symbol size in submodels
When you construct a submodel envelope around part of a model diagram, then the symbols inside it are the same size as the ones outside. Similarly, if you construct an empty submodel, then the symbols you place inside the submodel are, by default, the same size as symbols you place outside. In principle, one could construct a complex model, containing many (perhaps nested) submodels, with all the symbols being the same size at any level of nesting. In practice, however, this may be undesirable or difficult to achieve.
You can control the scale of the symbols inside the submodel relative to those in the desktop by using the "Relative scale" slider control in the "basic" tab of the submodel properties dialogue box. This dialogue box is displayed by double-clicking anywhere within the submodel, or by selecting the "Properties…" command from the context menu, which can be displayed either by right-clicking in the submodel or by opening the submodel in a new window, and using the "Edit" menu in this window.
The default symbol size is the same as the desktop, i.e. a relative scale of 1, and using the slider control it is possible to reduce this to make the symbols smaller. If you wish to make the symbols in a submodel larger than in the desktop, you must use the same slider control on the desktop window, either by double-clicking on the desktop or selecting the "Properties…" command from the context menu. This control allows you to reduce the absolute size of the desktop symbols, meaning that the symbols in submodels are now relatively larger.
Note that if you open a separate window to display the submodel's contents (e.g., by doubleclicking on its border) and then do zoom operations in that window, these may also affect the relative scale of the submodel contents. For instance, if you "zoom out" and this results in more whitespace being added around the components, then the scale is reduced because the extra space has to fit inside the same submodel envelope in the parent. This may also happen if you expand the separate window to display more space. Conversely if you "zoom to fit" in the separate window, this may trim whitespace from the submodel contents, causing their relative scale to increase so they fill the submodel envelope.
Working with model diagrams : Customizing the diagram's appearance
The "View -> Customize" menu selections display a dialogue that allows you to customize almost any aspect of the model diagram. You can change the appearance of just one type of component, or all components at once. The dialogue displays an example of how the component (a compartment if customizing all components) will look after any changes are applied.
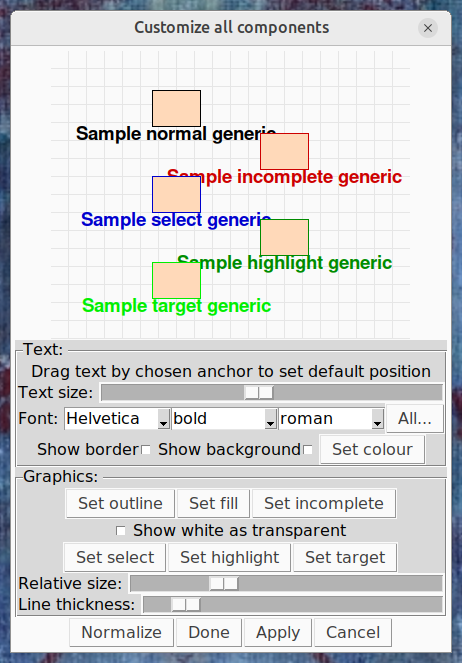
Text panel
This panel is displayed only when customizing a item type that has a caption, or the text box item type, or all item types at once.
Default caption offset and anchor
In this display, dragging the caption will set the relative position in which it appears to the component by default. This setting is overridden when dragging the captions of individual components on the diagram. The caption can be dragged by any of nine 'anchors' -- the four corners, the middles of the four sides, and the centre. Dragging the caption by an anchor sets the point that will remain the same when the text is changed; e.g., if it has been dragged by the top anchor, then adding new lines to the caption will cause it to be extended downwards.
Size and font
A horizontal slider allows the relative size of the text (relative, that is, to the scaling applied in whichever submodel the component is in) to be set. Below that, three drop-down menu buttons allow the font family, weight and slant to be set. Not all combinations of these are available on any given machine, and in the case that the desired combination cannot be displayed, a close approximation will be selected. The "All..." button to the right of these opens a separate dialogue from which any font available on the system can be selected.
Bounding box and colour
Text can be displayed with a bounding box, to allow it to show against a similarly coloured background and to make it easier to click on in a cluttered screen. The border and background of this box can be turned on and off with the appropriate checkbuttons in this panel. The border is the same colour as the text; the background is some other colour chosen to contrast with this. The "Set colour" button displays a dialogue which allows the default colour of the captions to be changed, although if a component is incomplete, selected or highlit, the caption will always be the same colour as the component's outline. When you hover over this button, it turns the currently selected colour.
Graphics panel
The graphics panel is displayed when customizing any item type except the text box, or all item types at once.
Colours
Items (except role arrows, influences and submodels, which have no fill) are drawn on the diagram using two colours, the outline and the fill. The fill colour is always the same, and can be set with the "Set fill" button. The outline colour depends on whether the component is incomplete, selected or highlit. "Set outline" sets the colour that applies if none of these are the case, and the other buttons set the colour for each of these cases. "Highlight" is the colour of a link between a selected and an unselected component, and "target" is the colour of a ghost when its base is selected, or vice versa, or a component highlit as a result of the highlighting choices in the View menu. All these buttons turn the currently selected colour when hovered over.
The colour used in a particular circumstance can be set to transparent. Any component or part of a component displayed as transparent will be invisible. A useful trick for very complex diagrams is to set the outline colour for influences to transparent. This prevents them appearing at all unless a component they connect to is selected.
Size and thickness
These sliders alter the size and thickness of each component type. Size is interpreted differently for some components; for a submodel it means the radius of the corner arcs, while for a link it sets the relative size of its arrowhead and 'blob' at the start, as well as the bowtie for flows.
Action buttons
This dialogue has four action buttons at the bottom:
- Normalize: reload the dialogue settings with Simile's defaults
- Done: Apply any changes to the diagram and quit the dialogue
- Apply: Apply any changes to the diagram and keep the dialogue open
- Cancel: Close the dialogue, ignoring any changes that were made since the last 'apply'.
If a model is saved after its appearance has been customized, the customization settings will be saved with it and restored when it is reopened, provided "Save models as canvas file" is selected on the Save tab of the Preferences dialogue. Otherwise no custoization will be saved and the model will have the default appearance when reopened.
In: Contents >> Working with model diagrams
Working with model diagrams : Controlling the amount of detail
Controlling the amount of detail shown in the model diagram
By default, Simile displays all the elements in the model diagram (except for ghost links): compartments, flows, variables, influence arrows, labels, etc. However, you may want to suppress the display of some of the elements to make the diagram less cluttered and less confusing, especially if you are showing a fairly complicated model to someone else for the first time.
Simile enables you to control:
- which types of elements are displayed; and
- the levels of submodel nesting that are displayed for each type of element.
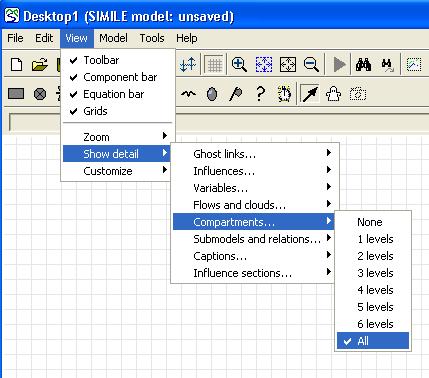
The first submenu for the Show detail item in the View menu enables you to select the type of element whose display you want to change. You can then select the submodel nesting level from a further submenu.
If you select:
None |
then that type of element is not displayed at all. |
| All |
then it is displayed at all levels. |
1levels |
it is displayed only at the top (Desktop) level. |
2 levels |
it is displayed at the Desktop level and the top level of submodel (but not the submodels nested inside the top-level submodels). |
The elements are arranged in order, such that turning off the view of compartments also turns off the view of variables at the same level. Turning off the view of variables also turns off the view of influence arrows, and so forth. This is to avoid producing nonsensical or misleading views.
Note that they apply within each window that displays part of the model. So, if you set submodel display to 1 level, so only the outlines of the submodels are displayed, then click on a submodel's boundary to open a new window for it, that window will show the contents of the submodel down to the next level.
There are three other mechanisms for limiting the amount of detail.
- If you open the properties dialogue box for a particular submodel and go to the Advanced tab, there is a checkbutton labelled "hide contents" in the Appearance panel. If you check this, the submodel will be displayed as an empty box, while other submodels at the same level still display their contents.
- At the bottom of the "Show detail" menu is a submenu for "Influence sections". This can be set to "Local", meaning only influences fully inside the same submodel are shown, or "Terminal" meaning only those actually connecting a component are shown, as well as "All", the default setting.
- As described in Customizing the diagram's appearance, you can set the default colour of a component's outline or fill to transparent. This is useful because it will then normally be invisible, but will show up if it is selected or highlit or becomes incomplete.
If you adjust the level of detail in a model's display, then save the model, these settings will be restored when the model is reopened.
Working with model diagrams : Following influences around
Following influences around the diagram
When creating a complex model, it can be very useful to see at a glance which components are influencing, and which are influenced by, the component you are looking at. This is particularly useful if you have a model spread over a very large diagram with ghosts used extensively to reduce the clutter of influence arrows. It is also very useful for debugging a running model - if you are looking at a component which seems to have the wrong value, it is useful to be able to jump to the values that are influencing that component to see where the error is creeping in.
Simile provides two mechanisms for following influences, one focused on the diagram and the other on the search mechanism.
Highlighting upstream/downstream
Normally, the selection is shown in blue, and the links to and from the selected area in dark green. There is also a set of highlit components, normally shown in light green (though all these colours are customizable, see "customizing desktop appearance"). The highlit components include the ghosts of components in the selection, and components whose ghosts are in the selection. But it can be modified to also include components influencing or influenced by those in the selection, at up to two steps away in either direction.
To enable highlighting of more components, select one of the last two entries of the desktop's View menu, 'Highlight Back' or 'Highlight Forwards'. Each of these has entries for One or Two functions, as well as the default setting of bases or ghosts only. Once this is done, components in the specified relation to the selection will be highlit immediately whenever a selection is made.
Searching for related components
This method causes the model diagram to scroll to show the relevant components, which is convenient for very large models. Make your selection in the normal way, then hit the 'Find' button as described in the Searching section. At the top of the dialogue that appears are three buttons, 'Components influencing selection', 'Components equivalent to selection' and 'components influenced by selection'. Hitting any of these buttons will start the search immediately; other fields in the search dialogue are ignored. One result is selected at a time, as for other searches, and the diagram scrolls if necessary to place the selected result at the centre. Since each result becomes a new selection, when you reach the one that is along the path you are following, you can immediately open a new search dialogue to continue searching from that point.
Working with model diagrams : Adding background pictures
Adding background pictures
There is limited support for including pictures on the model diagram.
To include a picture on the model diagram it can be in one of a wide range of formats, including gif, png or jpeg format. An image can be placed on the diagram using the image component, in which case it cannot overlap other components. Alternatively it can cover the whole desktop background, or a particular submodel. The image can be cropped, stretched or tiled to fit in the available space.
The following procedure is used to add a background image to the model diagram.
- Firstly, if you wish to use a submodel as a placeholder, add a submodel of the desired size and shape, as described in Adding submodels.
- Secondly, to add the picture, use the
 select tool to double-click within a blank area, within the submodel if you have added one, or if not, anywhere on the desktop. This invokes the submodel properties dialogue box. Then:
- Click the "Image…" button in the "Background shade" section.
- Browse your file system and select the picture you wish to use, which must be in gif or jpeg format, and click "Open".
- Select one of the "Tiled", "Centred" or "Scaled" radio buttons to control how it is positioned. "Tiled" or "Centred" will cause it to be cropped if it is larger in pixels than the space available.
- Click "OK" to return to the model window.
The selected picture will now appear in the background of the model, or on the model desktop. You can continue to work with the submodel exactly as normal. You can resize it, in which case the picture will be cropped, stretched or tiled as necessary, or add model diagram elements, which will appear in front of the picture.
The submodel's background colour, or whatever is behind it if it is transparent, will show through any transparent or low-alpha parts of the image.
Note that if the image is positioned centred (i.e., cropped if it is larger in pixels than the space available) the zoom commands do not affect the size of bitmaps (these are fixed in pixels). Therefore if a model diagram is zoomed in to higher magnification, the bitmap will appear smaller than before, relative to its placeholder.
Working with model diagrams : Saving and re-running a Simile editing session
Simile v6 introduces the ability to save and re-play the actions that are carried out in a model editing session. This is useful for presentation and training purposes.
Normally, when editing a model, the 'undo' and 'redo' buttons will move the process back or forwards one operation each click. But during re-play of a session, they can move the action forwards or backwards between pre-defined points. This is useful to skip to important points in the model development process.
To record a session, open a previously saved model or start with a blank desktop. While making changes to the model, when you reach a point at which you want the replay to pause, select View -> In replay -> Pause from the desktop menu. Do not save the model while recording a session, as playback will start from the last point at which a model is loaded or saved. When you have completed the session, select Export -> Session record, and choose a file name for it. It will have the .ssn extension.
To play back the session, in an empty model window, simply select Import -> Session record and navigate to the session you saved earlier. If the session started with opening a model, Simile will re-open the model. It will run through the session to the first point at which you selected a pause while creating it. Note that if you want to start with a view of the model you initially loaded, you should select a pause immediately after loading it.
You can now use the 'redo' button to jump forward through the session between the saved pause points. After the last pause, the model will jump to the end of the session. The 'undo' button will jump back to earlier pauses and eventually to the beginning of the session. You can navigate backwards and forwards through the session with the two buttons. If you start editing the model directly during a session playback, the part of the session after where you were when you edited it will be lost -- the 'undo' button will now take you back through your edits as normal, then back through the session jumping between pause points, and 'redo' will take you forward through the session and then into the new edits at the point at which you made them.
Long sessions can be recorded in several stages. After recording the first stage, you can save the model if required, then in a new empty desktop, play back the session and continue to work on the model, creating further pause points. When you save the session again, it will consist of the two sessions running one after the other.
Working with model diagrams : Preferences
Preferences dialogue box
You can specify your preferred settings for the interface. The settings are edited using the preferences dialogue box. The settings are stored between sessions in a file called "prefs" in the .simile hidden folder in your home directory. The settings are stored in this file automatically; there is no need to edit it yourself.
The preferences box is displayed by selecting the last item in the "Edit" or context menu, but the preferences always apply to the whole of Simile. It is a 'persistent' rather than a modal box, which means you can continue working with Simile while it is displayed. Most changes take effect instantly, though some only apply when you actually interact with the relevant part of the diagram (e.g., flow routing). Those where you have to type in a preference (e.g., numerical) can be made to take effect immediately by hitting Return. The "OK" or "Cancel" buttons will remove the box; "OK" saves changes to the preferences, while "Cancel" puts the preferences back as they were when it was opened.
The options are displayed in six sections, in a tabbed notebook in the box:
- Layout, for options relating to how the diagram window looks
- Content, for options relating to popups and dialogues
- Edit, to control the model design process
- Build, for options which affect how the model is converted into a program
- Save, for choices about how much information to save
- Run, for options about how the output of the model is presented.
Please consult each section for further help.
Preferences : Layout
Preferences dialogue box: "Layout" settings
Initial window position:
Your computer's operating system will normally decide where to put Simile's first window on your screen when you start it. This is usually the best choice, but on some setups you may prefer to always have it in the same place, in which case you can select "Where it was last time" in this panel, causing Simile to remember the position of the last model window when it closed.
In new model windows, display: bars and grid
When a new model window is created, which happens both when Simile is started or when a submodel is opened in its own window, the window is capable of displaying the standard toolbar, component bar and equation bar, if desired. Note that this does not change the display of the tool bars in existing windows. To control the display of the tool bars in existing windows use the "View" menu and check or uncheck the "Toolbar", "Component bar" or "Equation bar" items. The default is to display all three tool bars, unless the window is not large enough.
The display of the placement grid behaves the same way, but there is also a toolbar button to turn it on and off. Note that snapping to the grid can happen whether or not it is displayed.
Placement grid pitch and depth.
These choices allow you to set the vertical and horizontal pitch of the placement grid. Choosing different values for each of these results in a rectangular grid. The depth sets the visual prominence of the grid lines. How strong they actually appear will also depend on the display device. (Note that if your desktop or submodel background is very dark, you might want the grid to be lighter than the background, in which case enter a negative number here.)
Toolbar and popup formats
An alternative set of tool bar and component bar buttons is provided with 24x24 pixel graphical images. The default is to use 16x16 pixel graphical images.
Normally, hovering over any active object in Simile's display (e.g., buttons, menu entries) will pop up a message with a brief description of what it does. The second option on this tab turns these popups on and off.
By default, Simile's popup tool tips are rectangles drawn inside the window containing the component they describe, and cannot extend outside that window. Selecting 'Top-level popups' makes them draw as separate windows, which can look better although they may be positioned wrongly in some desktop setups.
Widget theme
Simile's user interface components can be configured to a number of different themes. The theme chosen by default is the one that most closely matches a typicall application on the platform you are using. If you prefer another theme, you can select it here, with immediate effect.
In: Contents >> Working with model diagrams >> Preferences
Preferences : Content
Preferences dialogue box : "Content" settings
Display popups over model components for equations, values and comments
While in  pointer mode, holding the pointer over any model component will cause a popup window to appear including that component's equation, value(s) (while the model is running) and description and comments. These can be suppressed by unchecking any or all of these options. If none is selected, the popups are suppressed completely.
- The equation is displayed on a green background.
- The description and comments are displayed on a brown background.
- The current value for the variable, provided you have built the model, is displayed on a yellow background.
The 'Size limit' sets the maximum number of characters that can appear in a field of a model component popup, in order to keep the boxes to a reasonable size. If there are more characters than this (e.g., values from a submodel with thousands of instances) then the middle of the text will be replaced with '.....'.
Normally, an array or list value is displayed as a sequence of indices alternating with values. This can be overlong and hard to read for multidimensional values, so as an alternative Simile v6.9 and later can pop-up 2-D values as matrices, where the indices are not displayed but can be inferred from the row and column positions of the values. This mode is selected with the 'Show 2-D values as matrices' checkbox.
Note that an alternative, especially for complex data structures, is to use the  snapshot tool.
Equation listings show parameter origins, enumerated type definitions, comments
The three checkboxes in this section control the behaviour of the equation listing generator.
- 'Parameter origins' lists the paths to each component whose value is used in the equation.
- 'Enumerated type definitions' lists the members of enumerated types with the submodels where they are defined.
- 'Comments' includes descriptions and comments added to all components.
In: Contents >> Working with model diagrams >> Preferences
Preferences : Edit
Preferences dialogue box : "Edit" settings
Snap-to-grid, Quick drag, Custom keypad button.
When "Snap to grid" is selected, any time a component is added to or dragged around the diagram, its position will jump to the nearest intersection on the placement grid. When submodel boundaries are dragged, they will jump to the nearest parallel line on the grid. This does not affect link routing, or caption or bowtie positioning.
When "Quick drag" is selected, collision detection is turned off when dragging components and boundaries, and only done at the end of the drag. This allows dragging to be smoother in very complex models on a slow computer.
The keypad in the equation dialogue has a button for inserting a special character (left of AC). By default this is μ, the 'micro-' prefix for physical units. In this box you can set it to any hard-to-find character you use frequently, e.g., π (the numerical constant pi -- copy it from here!). You can also set it to a word.
Select links end-to-end
Influences and other arrows that cross submodel borders are divided into sections. This option controls whether sections of influence arrows can be selected individually. The default is that clicking on a link at any point, or selecting either of its end points, will select all the sections of the link that are part of the same branch. This alternative, of selecting only the section clicked on, allows parts of a link to be deleted, leaving hanging sections that can be rejoined in different combinations. This is useful for separating and rejoining parts of a model, particularly when building a model from a selection of modules which can be connected together in different arrangements.
Link routing
Flows and squirts can be drawn as either a series of horizontal and vertical sections (following a rectilinear route) or as a straight line (at any angle) between source and sink. Checking or unchecking the 'kink flows' box does not cause the diagram to be redrawn immediately, but when flows are redrawn, they will be redrawn in the new style. The default is for rectilinear flow routing, i.e., kinked if necessary rather than diagonal.
Influences and role arrows are drawn with a default clockwise curvature, but their routes can be adjusted after adding them. The values here set the number of degrees through which they turn when first added -- zero means draw them straight, negative means curve anticlockwise.
Default background for submodels
Submodels can have a background colour and/or a background image, or neither, in which case the background is transparent. A transparent submodel will show the background of its parent submodel through it. This can look messy if the placement grids do not align, so Simile's default behaviour is to give new submodels their own white background. This opton allows new submodels to be transparent (or black for that retro glow look) by default instead.
In: Contents >> Working with model diagrams >> Preferences
Preferences : Build
Preferences dialogue box : "Build" settings
Use which C++ compiler
To run a Simile model at maximum speed, it is converted into a c++ program. This program must then be compiled into executable code. The Windows and (up to release 5.4) Mac versions of Simile include a compiler (GNU g++) and associated tools to allow the code to be created without anything else being installed. This is the 'Default' compiler choice.
The Linux and current Mac versions do not include a c++ compiler; there must be one present on your system. Most Linux machines have one already, and if you do not, it should be simple to add it via your distribution's package management tools. If you have installed Simile as a .deb or .rpm package, the installation process will ensure that the compiler is also installed from the repository. This preference option does not appear on Linux. The Mac version will prompt you to install XCode command-line tools when you run Simile, if it is not already installed. This includes the GNU c++ compiler, which will then be the only choice available.
Even if you have a built-in compiler, you may wish to use another that is present on your system. This choice allows you to do so. Models can be compiled and linked using either Microsoft Visual C++ (Windows only, any 32-bit version) or GNU G++ (version 2.95.2 or later). The GNU compiler is included in the XCode Tools for the Mac, and is available for Windows as part of the MinGW toolchain. Hence on Windows you will see the 'default' option, plus the 'GNU' and 'Microsoft' options if the appropriate compilers have been installed.
Pause to edit c++ code
This option allows you to look at, and perhaps modify, the c++ program generated by Simile before it is compiled. This can be educational, and allows you to include the model source code in other tools. Because it is primarily used for debugging, this option also turns on various other messages relating to code generation.
Extra compiler flags
An 'expert' option -- add text here to specify optimization, inclusion of debugging symbols, saving of intermediate files and other exotic compiler features.
In: Contents >> Working with model diagrams >> Preferences
Preferences : Save
Preferences dialogue box : "Save" settings
Save models as canvas or model file only
Saving canvas data to a separate .cnv file allows the screen to be redrawn more quickly when loading models. It does not affect the model itself, and all the diagram information is still saved with the .sml model file. The default is to save the canvas information.
Show how many reopen options
The "File" menu contains a recently-used file list, to speed up re-opening models. The number of entries on this list is controlled here.
Unsaved edits
These options control what to do if closing a window with an unsaved model (full or short save reminder) or if leaving the equation bar after having made changes to its contents (apply change, abandon change, or ask what to do in a dialogue).
Leaving equation bar
If you are editing a component's equation in the equation bar, you van save the new version by hitting newline or selecting the 'tick' button. This option specifies whether to also save the new version if you just go straight to some other action in the model window. If this is chosen, beware that you may get an error message at an unexpected moment if the equation is not valid when you exit the edit.
Saving .csv files
The most widespread version of the .csv data file format is to have the rows separated by newlines and the columns separated by commas. However, other column separators are occasionally used, such as semicolon and space (note that the entry field will appear the same with a space in it as with nothing!) This controls the column separator used when writing .csv data from the snapshot tool, the data table helper or the logging helper. The column separator to use when reading a .csv file can be set in the file parameter dialogue.
In: Contents >> Working with model diagrams >> Preferences
Preferences : Run
Preferences dialogue box : "Run" settings
Run time environment
Use single window: This option selects between the single-window and multiple-window run time environments. The former is the most common choice.
Reset sliders on model reset
This controls whether resetting a model to its initial state causes sliders that have been adjusted during the previous run to return to their default positions. The sliders will always return to default positions when re-running the model.
Position of run control and input sliders
When not using the single window run time environment, the initial positions of the run control and slider windows are specified here, in the form xy, x and y specify the desired location of window on the screen, in pixels.
Each of x and y must be preceded by + or - . If x is preceded by +, it specifies the number of pixels between the left edge of the screen and the left edge of window's border; if preceded by - then x specifies the number of pixels between the right edge of the screen and the right edge of window's border. If y is preceded by + then it specifies the number of pixels between the top of the screen and the top of window's border; if y is preceded by - then it specifies the number of pixels between the bottom of window's border and the bottom of the screen. For instance, "+100-100" would place the window a short way in from the bottom left corner. Enter "default" to use Windows built-in placement algorithm.
Numerical value precision
These set the number of significant figures that are used when a floating-point numerical value appears in a popup or a snapshot window. By default it is 12, and setting it greater than this will result in meaningless extra digits being added because the internal representation is double-precision. These displays may be easier to read if you select a lower precision. This setting does not affect data displayed in the I/O tools, which have their own means of setting precision.
Occurrences during execution
There are various things that can pause the model before the execution period set in the run control is complete. Some will always stop it, such as a 'stop()' function executing with a nonzero argument, or a discontinuity when adaptive step size variation is in operation. Others, such as compartment under/overruns, can be set to have that effect in the run control. In any case, a message is displayed in the log tab in the run control; selecting 'dialogue interactions' here causes a more prominent dialogue box to appear as well, requiring an 'OK' before the model can be restarted.
In: Contents >> Working with model diagrams >> Preferences