
Main menu
You are here
Optimizing model output
This is a simple example of optimizing output of a Simile model using SimileScripting and the Tcllib optimization package math::optimize. The script illustrates how to tackle this kind of problem.
"The package math::optimize is fully implemented in Tcl and no particular attention has been paid to the accuracy of the calculations. Instead, the algorithms have been used in a straightforward manner."
The script uses the procedure ::math::optimize::min_bound_1d that miminizes a function of one variable in the given interval. The procedure uses Brent's method of parabolic interpolation, protected by golden-section subdivisions if the interpolation is not converging. No guarantee is made that a global minimum is found. In the script the proceedure func is defined for ::math::optimize::min_bound_1d to evaluate. Proc func wraps up some SimileScript code that sets the input parameter value, resets the model and then runs the models. Finally it returns the value of a Simile model value for procedure ::math::optimize::min_bound_1d to minimize.
The package math::optimize also contains the procedure ::math::optimize::nelderMead that minimizes, in unconstrained fashion, a function of several variable over all of space, which may be worth experimenting with.
The model
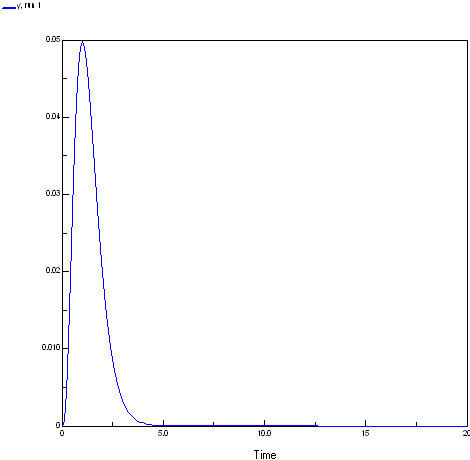
Model mathOptimize
			Enumerated types: []

		Variable   x
			x = 		Variable parameter
			Minimum = 0, Maximum = 10

		Variable   y
			y = 		x^3* exp(-3.0*x)
The response function of the model is shown below. To produce the plot the x values were set to the current simulation time.
The script
This script optimises the model output at the end of a run varying one input parameter. The script depends on math::optimize and uses the Plotchart package for a simple plot of the function output for a regular series of inputs the easiest way to get these package is probably to install ActiveTcl.
http://www.activestate.com/products/activetcl/
# This works to optimise for the last value of models runs.
	# The model is run for a set period (SetExecuteFor) and a parameter is set
	# to a given value at the start of the run.
	#

	# this script depends on math::optimize and uses the Plotchart for a
	# simple plot of the function output for a regular series of inputs
	# the easiest way to get these package is probably to install ActiveTcl
	# http://www.activestate.com/products/activetcl/


	# Where the extra libraries live MODIFY FOR YOUR CASE
	lappend auto_path {c:/program files/tcl/lib}; # eg ActiveTcl directories

	package require math::optimize
	package require Plotchart

	# Simulistics provided package
	package require SimileAutoObj; # not actually needed in Windows using SimileScript.exe


	# Create a Tcl object/command (modelWin) with which to control that instance of Simile
	similescript::ModelWindow modelWin

	# Tell Simile not to use the single window Model Run Environment
	# We are not going to use any helper anyway here.
	# We then load the model and build it using C++
	modelWin UseMRE false
	# MODIFY FOR YOUR CASE      MUST BE FORWARD SLASHES EVEN UNDER WINDOWS!
	modelWin Open "H:/mathOptimize.sml"
	modelWin Run


	# Create a runControl command/object with which to control
	# (as you might expect) the run control.
	similescript::RunControl runControl

	runControl SetExecuteFor 1
	runControl SetTimeStep 1 1

	# Create proc to run model and return value of variable to optimize
	proc func {x} {
	    runControl SetValue /x $x
	    runControl Reset
	    runControl Start
	    # multiply the value by -1 as we want the maximum value using a minimising optimiser
	    set y [runControl GetValue /y]
	    return [expr -1*$y]
	}

	package require Plotchart

	toplevel .t
	canvas .t.c -background white -width 400 -height 200
	pack   .t.c -fill both

	#
	# Create the plot with its x- and y-axes
	#
	set s [::Plotchart::createXYPlot .t.c {0.0 20.0 2.0} {0.0 0.05 0.01}]
	$s title "Shape of function we are evaluating"

	# evalute the model output for a range of input values ()
	# by plotting the output value for a series of input values
	# # multiply the value by -1 to get the original sign
	puts "Function shape"
	for {set i 0} {$i<=20} {incr i } {
	    set x [expr {$i/2.0}]
	    set y [expr {-1*[func $x]}]
	    puts "$x $y"
	    $s plot series1 $x $y
	}

	#puts "Maximum at(negative y value): [::math::optimize::min_bound_1d func 0.0 10.0]"
	set results [::math::optimize::min_bound_1d func 0.0 10.0 -trace on]
	set x [lindex $results 0]
	set y [expr {-1*[lindex $results 1]}]
	puts #####################################################
	puts {::math::optimize::min_bound_1d func 0.0 10.0}
	puts "Maximum at: $x = $y"
	puts #####################################################
	puts ""

	set results [::math::optimize::min_unbound_1d func 0.2 0.7 -trace on]
	set x [lindex $results 0]
	set y [expr {-1*[lindex $results 1]}]
	puts {::math::optimize::min_unbound_1d func 0.2 0.7}
	puts #####################################################
	puts "Maximum at: $x = $y"
	puts #####################################################
Results
You can see its search for the minimum if the trace is on:
(Run) 159 % ::math::optimize::min_bound_1d func 0.0 10.0 -trace on
	f(3.8196601125) = -0.000588169133818 (initialisation)
	f(6.1803398875)=-2.09302565156e-006 (golden section)
	f(2.360679775)=-0.0110514849929 (golden section)
	f(1.4589803375)=-0.039018178181 (golden section)
	f(0.901699437495)=-0.0490203182137 (golden section)
	f(0.178385003365)=-0.0033239934159 (parabolic interpolation)
	f(0.625417908211)=-0.0374683267348 (golden section)
	f(1.05516631149)=-0.0495683007526 (parabolic interpolation)
	f(1.01193600577)=-0.0497765137855 (parabolic interpolation)
	f(1.00189882668)=-0.0497867994449 (parabolic interpolation)
	f(0.99971913441)=-0.0497870624755 (parabolic interpolation)
	f(0.999993651474)=-0.0497870683649 (parabolic interpolation)
	f(1.00000018344)=-0.0497870683679 (parabolic interpolation)
	f(0.999999991611)=-0.0497870683679 (parabolic interpolation)
	f(0.999999891511)=-0.0497870683679 (parabolic interpolation)
	f(0.999997508029)=-0.0497870683674 (golden section)
	f(0.999998981102)=-0.0497870683678 (golden section)
	f(0.999999543765)=-0.0497870683678 (golden section)
	f(0.999999758684)=-0.0497870683679 (golden section)
	f(0.999999658584)=-0.0497870683679 (golden section)
	0.999999658584 -0.0497870683679
Maximum at: 0.999999658584 = 0.0497870683679
Files
- Simile model MathOptimize.sml
- SimileScript MathOptimize.tcl
- Printer-friendly version
- Log in or register to post comments