Main menu
You are here
Land-use dynamics - demonstration model
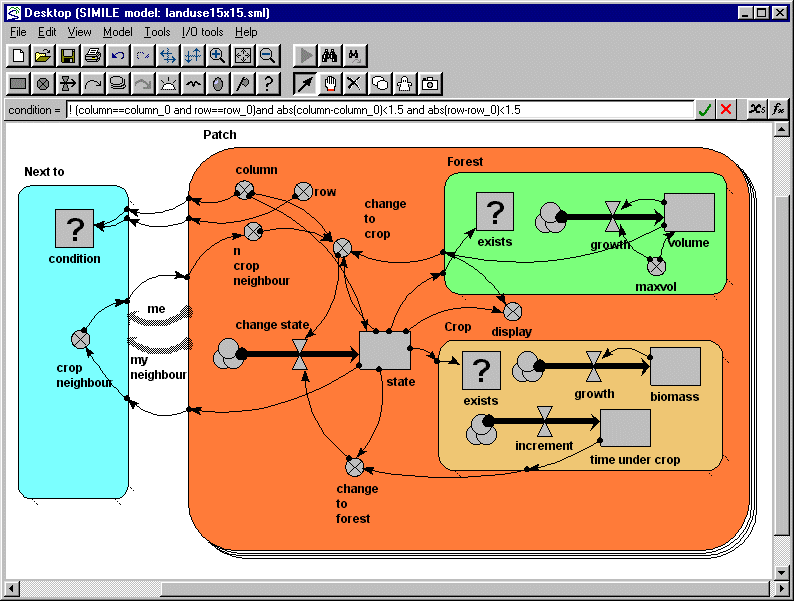
This model illustrates one approach to modeling land-use dynamics. In this case, individal units of land ("patches") can be in one of two states: forest or crop. Each patch can switch from one state to the other, depending on various factors including the current state of the forest or crop in the patch.
The model has a fixed-membership multiple-instance submodel to represent land patches. (In other words, we assume that there is a fixed number of patches.) Each patch contains a submodel for forest dynamics and a submodel for crop dynamics. Each of these submodels ia aconditional submodel: it either exists or it doesn�t in each patch. The condition for existence is determined by the current state of the patch, which (although it is represented by a compartment) is a two- value quantity: 1 for forest and 2 for crop.
Outside the Patch submodel is an association submodel, specifying the neighbours of each patch. This is necessary since we assume that a change in land use from forest to crop only takes place next to existing crop patches, so each patch needs to know who its neighbours are. The state of each neighbouring patch is passed through the association submodel, so that the patch can count up the number of neighbours uner crop.
The use of a compartment to represent the patch state deserves some explanation. Patch state needs to be represented in a state variable. A compartment is a state variable (it remembers its value from one time step to the next), so we can use it for this purpose. Compartment values can change only through the effect of one or more flows. Since land use state can have the value of only 1 or 2, we need to engineer the flow to be either 0 (no change in state), 1 (change from forest to crop), or -1 (change from crop to forest).
The model is available two versions using a :
- 15x15 grid (landuse1a)
- 40x40 grid (landuse1b; This must be built in C++.)
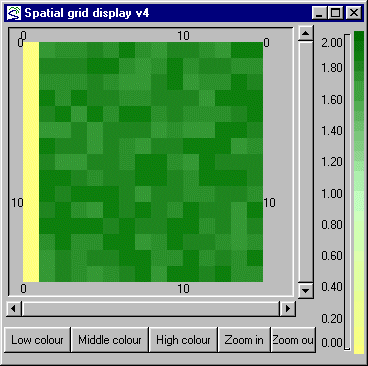
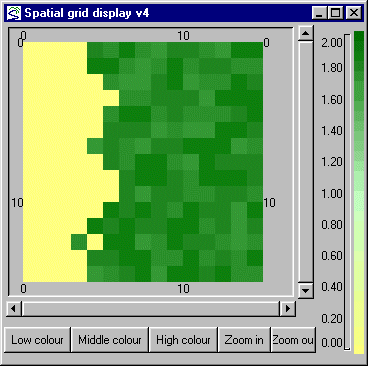
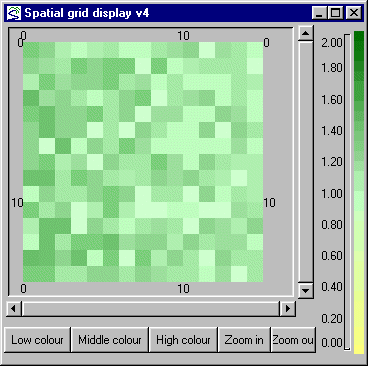
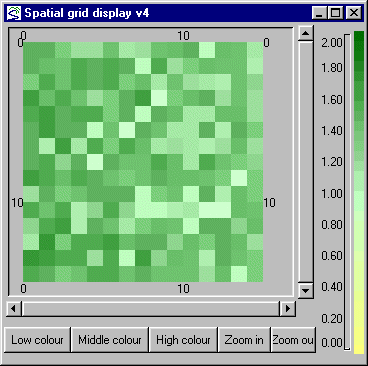
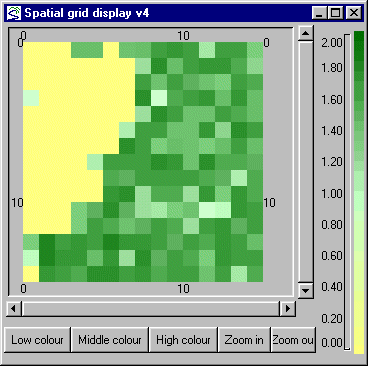
The following sequence of screen shots shows how the cropping area on the left (yellow) gradually encroaches into the forest. It is then replaced by young forest (light green), until eventually it in turn is cut down and the cycle continues.

| Attachment | Size |
|---|---|
| 91.99 KB | |
| 91.7 KB |
