
Main menu
You are here
Running models : Working with visualization tools : Layers
Layer display
The layer display tool differs from Simile's other display tools in that it allows a number of different types of display to be superimposed to create a composite image of processes in a 2-D modelled world. When the layer display is selected, a blank window appears in the run environment, and the 'Add' menu is replaced by a 'Layers' menu which allows the modeller to add instances of layer tools to the display, and to manipulate existing layers.
There are currently four different layer tools:
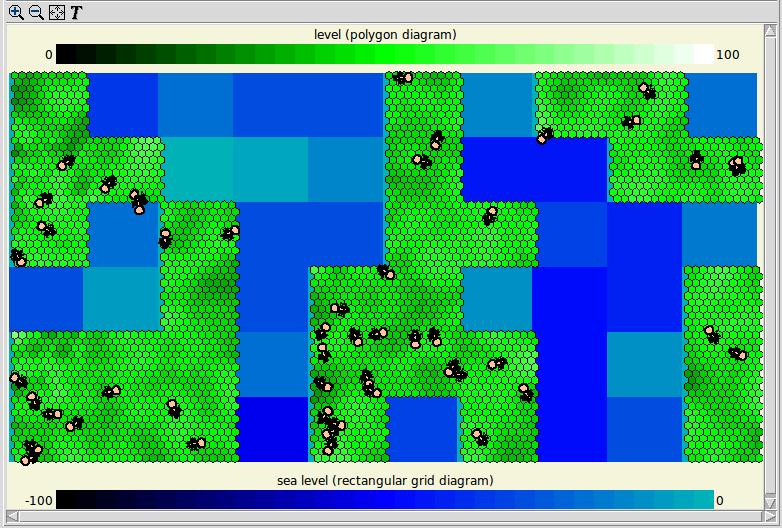
- Spatial grid map
- Polygon map
- Input pointer (Simile v6.12 on)
- Background photo
- Moving individuals
As of Simile v6.9 there are also a set of '2-D shapes' tools, for adding layers consisting of circles, lines or ellipses. These are analogous to the corresponding object types in the 3-D Shapes tool.
The spatial grid and polygon maps are similar to the corresponding stand-alone spatial grid and polygon tools, with the exception that they cannot be used to change values of model components. The background photo tool simply allows an image to be displayed behind anything that is added by the other tools, and the moving individuals tool displays icons (specified as series of Tk canvas drawing commands) for members of a submodel which includes values representing their co-ordinates in a 2-D space.
Layers menu
When the layer tool is first added, the layers menu will consist of a single entry labelled "Add new layer here". This cascades to a set of menus listing the available layer tools according to their source, like the menu for selecting the regular helper tools. Once a layer tool is added, the modeller will be prompted to select files and/or click on model components whose values will control the layer display, after which the layer will be added to the display. The layers menu now has a new entry for this layer, with 'Add new layer here' entries above and below it.
Once layers have been added, the menu lists all the existing layers, with 'Add new layer here' entries above, below and between them to allow new layers to be added at any position in the stack. Selecting the entry for an existing layer cascades to options to move the layer to the top or bottom of the stack, up or down one level, delete it or open its properties dialogue. A layer's properties dialogue will have a set of input widgets, some of which are unique to the layer type, and some common between various layer tools. The common ones are:
- Select colours: This allows the colours representing the different model values (as shown in the legend) to be changed.
- Range: The range of values covered by the colour spectrum can be widened or narrowed.
- Offset and scale: Normally, data with the same numerical X and Y coordinates will display at the same point in the window in any layer tool, but these values adjust the display position of each layer. They can be used to compensate for different coordinate units being used in different parts of your model, or to show different maps side by side in the same window.
- Legend side: For tools that can display a legend, this selects at which side of the window it appears, if at all. If multiple legends are added to the same side, the ones for the higher layers will be drawn on the inside.
In: Contents >> Running models >> Working with helpers
- Printer-friendly version
- Log in or register to post comments