Main menu
You are here
Running models : Working with visualisation tools : Plotter
Plotter helper
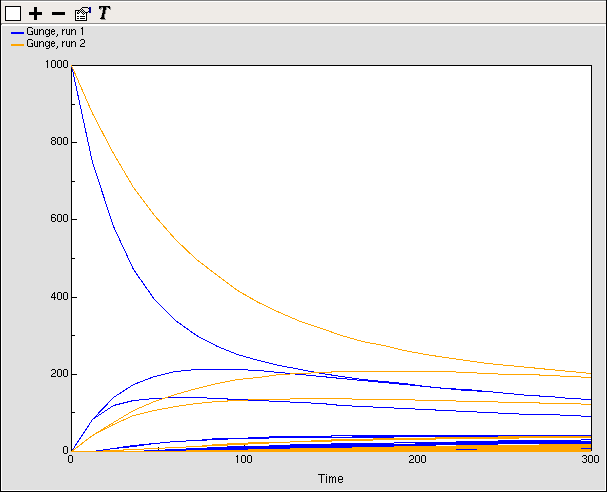
The plotter helper is for plotting graphs of one or more variables against time. If a variable has many values, e.g., one in a multiple instance submodel, all the values will be plotted. Different colours are used for different variables, and for data from successive model runs. Hovering over a trace on the diagram will result in a popup window giving the indices of the particular value it represents, the time in the run at which that point was plotted, and its value at that time and at the current time.
 Clearing the display
To remove all the plotted data, click on the ![]() button.
button.
Selecting elements to plot
One or more elements can be added to the graph.
- to add an element, click on the
 button. An instruction is then posted to click on the model element to be plotted. This can be on the model diagram or in the model explorer.
- to remove an element, click on the
 button. An instruction is then posted to click on the element to be removed, in the legend of the graph. Data already plotted for that element will not be removed untiil the clear
  button is clicked.
Highlighting a trace
Clicking on one of the traces will highlight it by drawing it in double thickness. You can highlight many traces at once. Clicking on it again will reset its display state to normal.
In: Contents >> Running models >> Working with helpers
- Printer-friendly version
- Log in or register to post comments

