Main menu
You are here
Urban model (trivial example)
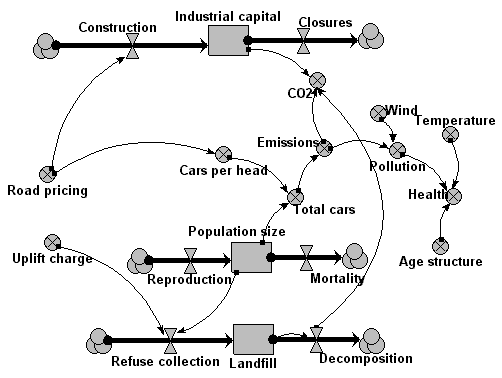
This (entirely hypothetical model) aims to demonstrate the potential for developing urban policy simulators. The model contains a number of stocks (industrial capital, population size and landfill), and a number of policy levers that the user can manipulate (road pricing and a rubbish uplift charge). Models like this, expanded and calibrated for particular cities, can be used in a black-box manner, where stakeholders want to see the consequences of different policies. But the big advantage of a visual modelling approach is that the structure of the model is transparent, so that those stakeholders who want to can contribute to a process of critiquing and refining the model.

Industrial capital = 1000
Landfill = 1000000
Population size = 500000
Closures = 10
Construction = graph(road_pricing)
Decomposition = 0.2*landfill
Mortality = 9000
Refuse collection = graph(uplift_charge)*population_size
Reproduction = 15000
Age structure = 1
Cars per head = graph(road_pricing)
CO2 = 0.5*emissions+100*industrial_capital+0.5*decomposition Emissions = 1.0e-006*total_cars
Health = temperature*age_structure*graph(pollution)
Note: temperature and age_structure are (at this stage) 0-1 multipliers that cause the effect of pollution to be even worse if either is suboptimal
Pollution = emissions*graph(wind)
Road pricing = 0
Temperature = 1
Total cars = cars_per_head*population_size
Uplift charge = 0
Wind = 2
| Attachment | Size |
|---|---|
| 53.42 KB |
