
Main menu
You are here
Running models : Working with visualisation tools : Profiles
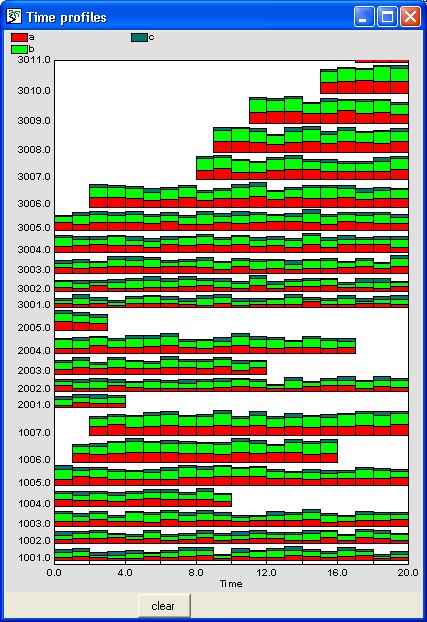
Time profiles helper
The time profiles helper is designed to show multiple attributes of each
instance of a population submodel. Each instance must be assigned a unique
identifier, which is plotted sequentially on the y-axis. A stacked bar
chart display is used to plot an arbitrary number of properties of that
instance against time.
For example, each individual in a population may hold wealth in the form
of property, stocks and shares, and cash. The time profiles helper will
display the changing wealth of each individual over time (the total height
of each bar) as well as the make-up of that wealth (the height of each
coloured segment).
For best results, the variables plotted should be scaled to be less than
50. Panning and zooming operations are implemented as for the plotter helper. The y-axis can be panned up or down and
the x-axis panned left or right to display different parts of the axis at
the same magnification, whilst both axes can also be zoomed in or out to
increase or decrease the magnification.
-
 The cursor takes on the shape of a
four-headed arrow when placed over a scale point. Dragging a scale point
alters the range displayed by zooming in or out. To zoom in, drag the
scale points away from the origin, i.e. to the right (on the x-axis) or
upwards (on the y-axis). To zoom out, drag the scale points towards the
origin, i.e. to the left (on the x-axis) or downwards (on the y-axis).
-
 The cursor takes on the shape of a
two-headed arrow when placed over the axis itself. Dragging the axis
alters the range displayed by panning up or down, left or right.
In: Contents >> Running models >> Working with helpers
- Printer-friendly version
- Log in or register to post comments