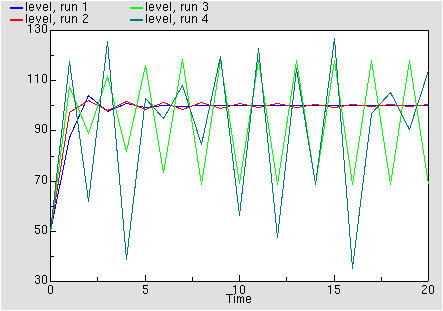
This graph shows the results of four consecutive runs with gain set to 1.4, 1.9, 2.3 and 2.7 respectively. On the first two runs the level approaches equilibrium; on the third it oscillates around the equilibrium, and on the final run it shows chaotic behaviour. Other behaviours such as period doubling will be shown for other values of gain.
This graph illustrates the unpredictability of chaotic behaviour. The model includes a very small random variation in the initial value of level, but the values for three consecutive runs, all with gain set to 2.7, diverge after about 60 time units. Until this time, the plot for the last run (green) exactly overwrites the other two.
