Main menu
You are here
Ecosystem energy flow
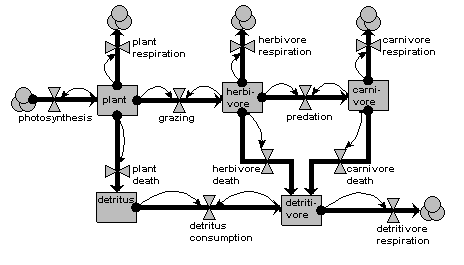
This model represents the flow of energy through the different components of an ecosystem. It is a classic compartmental model, conforming to conventional System Dynamics notation, and could be represented in any of the standard System Dynamics visual modelling packages.
The model has five compartments, representing the energy content (in joules perhaps) in each of five ecosystem compartments:
- the primary food chain, consisting of
- plants
- herbivores
- carnivores
- the detritus chain, consisting of
- detritus
- detritivores
The flows show the processes that move energy from one compartment to the next. The overlapping circles represent clouds, signifying a System Dynamics ‘source/sink’: in effect, a compartment outside the system, whose value we are not interested in. The thin arrows represent influences, and indicate which compartments are deemed to influence each flow: i.e the flow rate is dependent on the value in the compartment.

Note that, though very simple, there are still significant design decisions indicated here. For example, the feeding flows are shown to be dependent on the amounts in both the food compartment and in the feeding compartment. Also, we assume here that dead plant material goes into a detritus compartment, because of its relatively long residence time, whereas dead animal material is consumed immediately by the detritivores.
