Main menu
You are here
Modelling the clinical and cost effectiveness of screening for MRSA in hospitals
Introduction
Staphylococcus aureus is a bacterium that many healthy people carry without it causing infection. However, if it enters the body, it can cause a range of illnesses from minor localised skin infections to systemic life-threatening illnesses.
Antibiotics are used to treat more serious staphylococcal infections but some strains of Staphylococcus aureus have developed resistance to commonly used antibiotics including meticillin. Meticillin-resistant Staphylococcus aureus (MRSA) is a major cause of healthcare-associated infection. Infections with MRSA are associated with greater risk of treatment failure, increased patient mortality, and high costs.
A number of hospital management strategies are available for reducing the prevalence of MRSA in hospitals. These include:
- Screening patients to identify MRSA carriers (referred to as 'colonised', meaning that they have the MRSA bacterium on their skin). Screening involves taking swabs from one or more body sites, followed by laboratory analysis of these samples.
- Decolonisation treatment for identified carriers
- Isolation, for identified carriers or pre-emptively.
In 2006, Quality Improvement Scotland, a specialist board within NHS Scotland, undertook a Health Technology Assessment (HTA) to evaluate "The clinical and cost effectiveness of alternative screening programmes for MRSA for patients admitted to hospital". The HTA involved the analysis of evidence from scientific literature, experts, professionals groups and patient interest groups. In addition, a modelling study was undertaken to assess the clinical and cost effectiveness of alternative screening strategies.
The model was implemented using Simile, with the initial model development undertaken within QIS. Simulistics, under contract from QIS, completed model development and provided support for the detailed analysis of model behaviour.
Modelling approach
The modelling approach is based on stock-and-flow modelling (commonly known as System Dynamics), in which a system is represented as a set of pools with flows into, out of and between them. In this case, the pools represent number of people.
In conventional System Dynamics, the stocks and flows represent the amount and rate-of-flow of some substance (e.g. water). These models generally involve values on a continuous scale (e.g. 10.357 litres), and are usually deterministic (you get the same result each time you run the same model).
It is not appropriate to model small numbers of individuals in this way. Therefore, this model has been engineered so that all the flows are in terms of whole (integer) numbers. Because of this, the model needs to use stochastic (probabilistic) methods to decide randomly whether the value of a flow will be 0, 1, 2 or 3 individuals if the mean rate is (for example) 1.357. The main method used is to sample from a binomial distribution, to generate a number of individuals given a population size n and a probability p of some event happening.
Description of the model
The model represents a single hospital and the community it serves. The following table sets out some of the assumptions used in the modelling process, and the corresponding realisation of these assumptions in the Simile model.
| Real-world assumptions | Representation in the Simile model | Simile diagram |
|---|---|---|
|
The people in the community may be colonised or uncolonised with MRSA (i.e. the bacterium is or is not present on their skin). They may have a low or high risk of being admitted to hospital, and they are in the under 65 or 65-and-over age group. People in the community may change their colonisation or risk-of-re-admission status. |
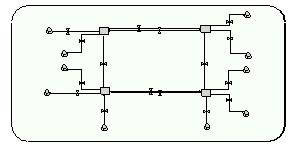
The community submodel contains a single, 2-instance submodel, one instance for each age group. Four compartments in the submodel represent the number of people in each colonisation and likelihood-of-admission class. E.g. the compartment HRR_U represents the number of people with a high risk of re-admission who are uncolonised. There are flows between each of these 4 compartments. |

The community age-group submodel (2 instances, 1 instance for each age group). Left 2 compartments: uncolonised people; right: colonised. Top 2 compartments: low risk of re-admission; bottom: high risk. |
|
The hospital has 2 emergency wards and 34 speciality wards. 15 of the speciality wards are 'high risk', in that a patient has a higher risk of acquiring an MRSA infection while there. Within each ward, patients are either in the under 65 or 65-and-over age group. Within each ward, patients may be in one of several states with respect to their MRSA status, depending on whether they are known/not-known to be colonised/infected with MRSA. |
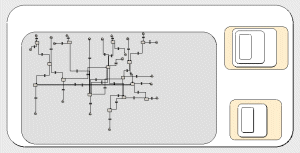
A single, 2-instance submodel is used for the emergency wards, and a single, 34-instance submodel is used for the speciality wards. Of these the first 15 instances have a value 'true' for the variable 'high-risk speciality'. Each of the 2 ward submodels contains an inner 2-instance submodel, one for each age group. Compartments are used within the ward submodels to represent the number of patients in each state, with flows to model the movement of patients between categories. |

The speciality ward submodel (34 instances, since there are 34 wards). The inner grey submodel is for the 2 age groups. The compartments are for number of patients in different categories. The small nested submodels are for selecting admission to the wards and the isolation rooms respectively. |
|
Each ward may have 1 or more isolation rooms, to isolate patients according to their MRSA status. |
Two of the compartments in the ward submodel are used to represent the number of people in isolation rooms. |

Close-up view of the isolation room compartments in each ward. "IW C" and "IW I" are the number of colonised and infected patients respectively in isolation rooms in the ward. |
|
Six screening strategies are considered (listed below this table). |
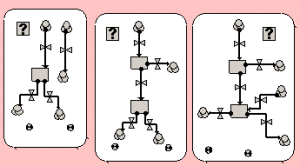
Each screening strategy is represented by a separate submodel. Each submodel contains a 'condition' symbol, and only the condition symbol for the currently-selected strategy is set to 'true'. Thus, for any one run, only one strategy is in operation, even though all 6 are represented in the model. Some of the strategies involve the use of "zero-valued compartments". These are compartments whose outflows always equal inflows. This approach is used to show the flow of patients through the system, even when there is no residency time at a particular stage - e.g. assessment by a health practitioner of a person's chance of being MRSA-colonised. |

Three of the screening strategy submodels. The flow pathway shows the movement of people through the screening process. Note the use of the condition symbol [?] in each one, to ensue that only one strategy is in use at any one time. |
The six screening strategies
The 6 strategies represent alternative screening options for incoming patients. In summary, they are:
- Do nothing - treat all patients as uncolonised;
- Swab all patients to identify colonised individuals;
- Swab patients going for high-risk specialities - treat others as uncolonised
- Carriage assess all patients (i.e., assess their risk of colonisation from their clinical history) and swab those with a positive assessment. Treat others as uncolonised;
- Swab all patients going for high-risk specialities, carriage assess others and swab those with a positive assessment
- Swab all patients, also carriage assess them and treat those with positive assessment as colonised pending swab results.
Using the model
Data sources
The model requires a range of input values. These can be classified as follows:
- Management variables
These are factors over which management has some control. The model was constructed in order to explore the way the outputs of the model (the indicators of performance, see below) changed depending on different values for these inputs. The main one is screening strategy (one of the 6 listed above). Others include the number of isolation rooms in the emergency wards and the low-risk and high-risk speciality wards, and the effectiveness of decolonisation treatments in the different types of ward. - Domain parameters
These are parameters which relate to the specific hospital being modelled. These include the number of people in the community served by the hospital, and 'swab delay', the time it takes to get the results back for a swab test. - Estimated parameters
These relate to the biological and epidemiological properties of the system itself. These include:- the proportion of swab tests and carriage assessments which correctly identify colonised patients;
- the false-positive rate for these procedures;
- the spontaneous rate of decolonisation of colonised patients;
- cross-infection parameters - probability of one patient becoming colonised through the presence of another.
Settling-in period
For any one scenario, there is a lack of detailed information on the number of MRSA-colonised people in the hospital and the community it serves, in each of the various categories. To overcome this, the model starts off with an empty hospital and the default management strategy, and runs for 3000 days, giving equilibrium numbers which correspond to observed figures. The run then continues with the chosen strategy switched on.
Running the model
Interactive use
During development, the model is run in Simile's usual interactive environment. This allows rapid interaction between the model-design process and test runs of the model.
Batch-mode use
However, analysis of the model's behaviour requires a large number of runs to be performed. This is partly because there are a wide range of management scenarios to be investigated, but mainly because the model is stochastic (probabilistic). This means that the results obtained from two runs will be different, because of chance effects in the model, even when all the inputs are identical. For these purposes, use is made of Simile's scripting environment, which enables a model to be run under control of a script. The script can set the inputs to a model run, control the number of times the model is run for any one set of inputs, and collate the results of many runs for subsequent analysis.
Results
Single runs
Prevalence of MRSA
The following graph shows the prevalence of MRSA (percentage of people colonised) in the community (red) and the hospital (blue). You can clearly see the transition from the run-in period of 3000 days, with no MRSA management strategy in place, to the introduction of the management strategy used in this run.

Costs associated with MRSA control measures
The following graph shows the costs associated with the introduction of MRSA control measures. These only apply after the 3000-day run-in period, and are broken down into costs associated with screening (orange), isolation of patients (blue), decolonisation treatments (green) and running labs (brown).

Aggregate results (batch-mode runs)
The results from batch-mode runs were exported to a spreadsheet and analysed in terms of MRSA prevalence and costs of various strategies. The following figure is an example (taken from the Health Technology Assessment report). It shows the prevalence of MRSA in the hospital under 3 strategies for 2000 days following the introduction of the specified strategy.

Links
NHSScotland /Quality Improvement Scotland: HTA 9: The clinical and cost effectiveness of screening for meticillin-resistant Staphylococcus aureus (MRSA)
Main page pdf 1.44MB (See chapter 6: "Economic Evaluation and Modelling")
Accessing the model
A zipped file containing the model plus associated files is attached to this page. To use the model, unzip the file onto your own computer, start Simile, and load the model file (TRH_2008_model_package.sml). Simile should open up the RunTime window. Click on the Start button (the right-facing triangle, like the play button on a CD player) to run the model. Press it several more times to continue running the model.
28 September 2010 The attached file (TRH_2008_packageSimile.zip) has been updated to build and run in Simile 5.7 with no warning messages. (Better compatibility checking in Simile 5.7 flagged a comparison of an enumerated type with its corresponding representation as an integer. Full use of enumerated types makes the model easier to read.)
The model should run in the free Evaluation Edition of Simile, available from http://www.simulistics.com/products/simile.php. If you already have Simile, you may need to upgrade to the most recent version (currently Simile 5.3) to run this model.
| Attachment | Size |
|---|---|
| 1.78 MB |
